The probabilistic graphical model is the following Directed acyclic graph. The shared hyperparameters lie outside the plate; the plate repeats the local variables for . The observed colour is shaded, and the known error variance is a square.
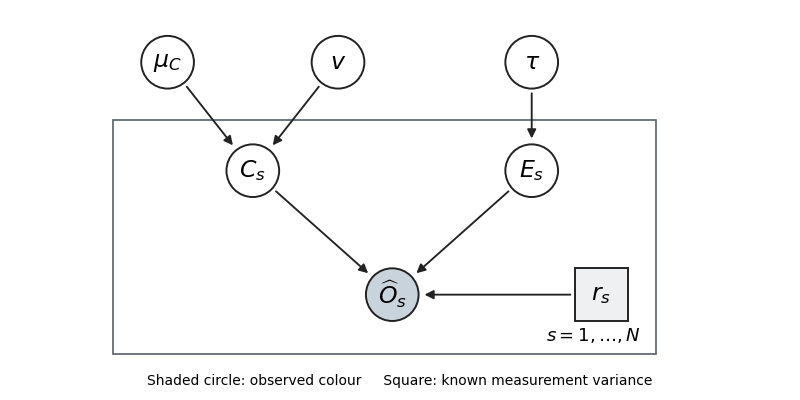

Thus the parent sets are . Independent hyperparameter prior factors are represented by the three root nodes. With the printed improper priors this is a factorization diagram; it becomes a normalized generative model after proper priors are supplied.
Articles by others on the same topic
There are currently no matching articles.