A reliability diagram compares predicted probabilities with observed outcome frequencies to assess probability calibration. For the positive-class version of binary classification, partition observations into bins according to their predicted probabilities . For every nonempty bin, plotwhere is for a positive outcome and otherwise. Agreement places the estimated points near the diagonal . Empty bins have no observed fraction and should not be plotted as zero.[ref]
Probability calibration in the scikit-learn documentation. Section 1.16.1: mean predicted probabilities and fractions of positives
Binning can hide important structure. Consider ten cases each assigned , of which eight are positive, and ten cases each assigned , of which two are positive. Separate bins give and , revealing strong disagreement. Merge all 20 cases into one bin: the mean prediction becomes and the positive fraction is . The single point lies on the diagonal despite the two-group discrepancy.
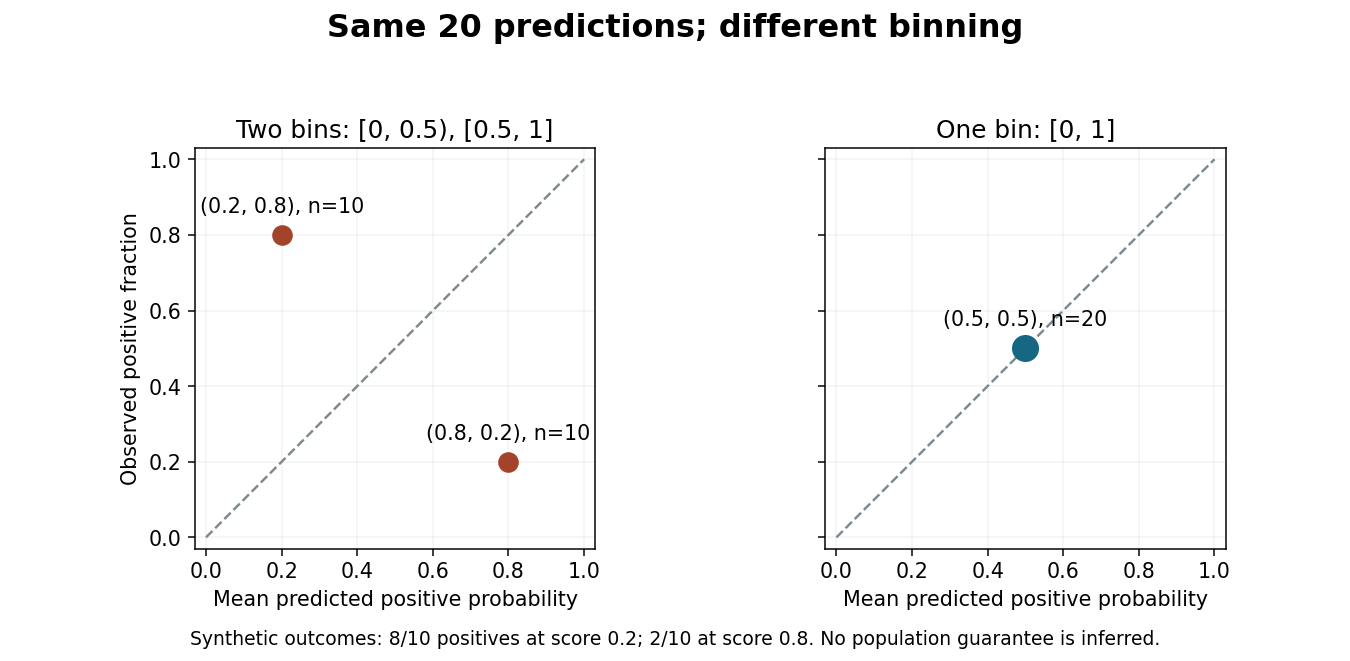
Merging bins can hide disagreement in a reliability diagram.
Original synthetic binary classification example with the same 20 predictions and outcomes in both panels. Points show positive-class frequencies; the diagram does not establish a population guarantee. Details.
Report bin definitions and counts, since a point based on ten cases has different sampling uncertainty from one based on thousands. Some classification diagrams instead plot confidence in the selected label against the fraction of correct selections. That convention and the positive-class version answer related but distinct questions, so label the axes and the meaning of the outcome explicitly.[ref]
On Calibration of Modern Neural Networks by Chuan Guo and others. Section 2: selected-label accuracy/confidence convention and limitations of a reliability diagram without bin populations
Articles by others on the same topic
There are currently no matching articles.