
2D IR cross peak 2026-11-05
A 2D IR cross peak is an off-diagonal spectral feature correlating excitation and detection frequencies that differ in a two-dimensional infrared spectroscopy experiment. Its location is a relation between frequency coordinates, not a second physical location in the sample. Such features can reveal interactions between vibrations, but their interpretation depends on the measured response and timing.
For a concrete primary example, phase-controlled peptide spectra showed cross peaks interpreted as coupling between amide-I modes. The experiment measured the phase as well as amplitude of vibrational photon echoes, supplying information beyond an unsigned intensity map.[ref]
An original positive-envelope model illustrates 2D IR diagonal-peak overlap. Let and put two purely diagonal features at frequencies and :At the off-diagonal coordinate , this model givesFor , and , all in , the value is approximately0.0879. The diagonal value is approximately1.0019. Thus a nonzero off-diagonal pixel about8.8% of the diagonal height can arise solely from broad diagonal tails, with no separate cross feature in the stipulated model.
A real response can have positive and negative components, so this envelope is not a universal line-shape formula. It demonstrates why a peak assignment needs a fitted background/overlap model and appropriate spectral resolution, rather than the observation of any off-diagonal intensity.
Changing 2D IR waiting time, polarization or sample conditions can test proposed mechanisms. Growth or decay of a 2D IR cross peak alone does not uniquely establish chemical conversion: coupling, relaxation and changes in response factors can contribute. Interpret the feature jointly with the rest of the spectrum and the experimental pulse sequence.
2D IR diagonal-peak overlap 2026-11-05
2D IR diagonal-peak overlap is the contribution of extended diagonal spectral features to regions where an off-diagonal signal might be assigned in two-dimensional infrared spectroscopy. A nonzero value at an off-diagonal coordinate is not sufficient evidence for a separate 2D IR cross peak.
Peak orientation matters as well as width. An original positive-envelope model for a diagonal feature centered at isHere specifies 2D IR line-shape correlation. It is a shape parameter in this illustrative model, not automatically a measured population correlation. Let for two diagonal features, with . At the off-diagonal coordinate ,For original values , and , all in , the off-diagonal amplitude is approximately 0.0879 at , but only 0.000340 at . Both models have the same individual marginal width. An overlap estimate based only on that width can therefore miss a substantial shape dependence.
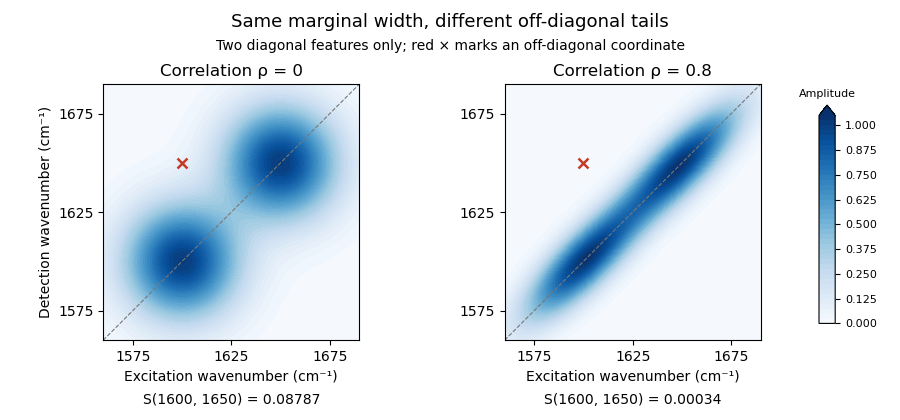
Original two-diagonal-feature model: changing 2D IR line-shape correlation changes off-diagonal tails without adding a 2D IR cross peak
. Details. The toy envelope is positive. Actual coherent spectra can contain signed features, so fitting and subtraction must respect the measured response and phase convention. The primary phase-controlled peptide experiment used phase and amplitude information to interpret mode-coupling cross peaks.[ref]
Useful tests vary the fit region, include plausible neighboring features and compare the proposed cross signal across 2D IR waiting times and other controlled conditions. A residual can indicate a missing feature, an unsuitable diagonal line shape or an unmodeled background. Its persistence alone does not uniquely select one molecular explanation.
2D IR response-factor correction 2026-11-05
2D IR response-factor correction adjusts a measured signal ratio when the spectral components being compared do not produce equal response per unit population. It is part of 2D IR population normalization, rather than a rule that every 2D IR cross peak directly counts transferred molecules.
For positive fitted components, suppose and , where is the fraction of interest and is a shared population-survival factor. Define the 2D IR response-factor ratio . The measured fraction obeysThe second expression follows by solving the first; requires in this model. An original example uses , and . The raw ratio is , while the corrected fraction is .
The effect is especially transparent on an odds scale:At , a small relative error of in changes the inferred fraction by about in magnitude to first order. Using instead of in the example gives . A response factor that is uncertain should contribute to uncertainty propagation, rather than being treated as an exact correction.[ref]
Evaluation of measurement data — Guide to the expression of uncertainty in measurement by JCGM. Sections 5.1–5.2, sensitivity coefficients and correlated inputs
A useful experimental check measures a suitable reference under the same pulse, detection and fitting conditions, and asks whether the inferred response ratio transfers to the unknown sample. Common multiplicative gain cancels; additive background, differing response pathways or a changing ratio need additional modeling. Primary phase-sensitive peptide measurements recorded both phase and amplitude of vibrational photon echoes, illustrating why the fitted response component must be specified.[ref]
Two-dimensional infrared spectroscopy of peptides by phase-controlled femtosecond vibrational photon echoes by M. C. Asplund and others. Abstract, phase matching and heterodyne measurement of echo phase and amplitude
Signed or complex spectral components do not satisfy the positive-component population model merely because they have been divided by a sum. 2D IR response-factor ratio 2026-11-05
The 2D IR response-factor ratio compares the response per unit population of two specified spectral components. In the positive-component model used for 2D IR response-factor correction,Here is the population fraction of interest and a shared survival factor. The 2D IR response-factor ratio is a property of this measurement model and its conditions, rather than a universal property of every 2D IR cross peak.
An independently characterized reference can identify if the model applies. For reference fraction ,For an original example, , and give . An unknown with and then has corrected fraction , whereas its raw 2D IR population normalization ratio is .
Using an unknown fraction to estimate and then using that same to recover the fraction would be circular. The reference needs independent information. Moreover, 2D IR response-factor transferability must be tested when pulse spectrum, polarization, 2D IR waiting time, detection or fitted response pathway changes. A common multiplicative gain cancels from ; a component-specific gain does not.
First-order uncertainty propagation is transparent on the logarithmic scale:At , a standard uncertainty in the reference fraction alone contributes about to the relative standard uncertainty of . Fractions near zero or one make that sensitivity larger. Shared inputs require covariance terms, rather than independent addition of every uncertainty contribution.[ref]
Evaluation of measurement data — Guide to the expression of uncertainty in measurement by JCGM. Sections 5.1–5.2, sensitivity coefficients and correlated inputs
A phase-resolved experiment also needs a stated choice of real, imaginary or fitted component: the primary peptide experiment recorded phases and amplitudes of vibrational photon echoes.[ref]
Two-dimensional infrared spectroscopy of peptides by phase-controlled femtosecond vibrational photon echoes by M. C. Asplund and others. Abstract, phase-controlled echoes and heterodyne readout
A ratio of signed or complex values does not automatically satisfy the positive population model. 2D IR response-factor transferability 2026-11-05
2D IR response-factor transferability means that a response ratio characterized under one set of conditions remains applicable to another measurement. It is an assumption to test when using a 2D IR response-factor ratio to infer populations from spectral amplitudes. A common detector gain can cancel from a ratio, while different gains or optical responses for its two components do not.
In the positive-component measurement model, writeThe shared survival factor cancels. If conditions change the responses to and , then . Equality of and is a substantive requirement, not a consequence of both signals coming from the same instrument.
An original error calculation supposes a reference established , but the unknown measurement actually has . For true population fraction , its observed amplitude ratio is . Using the old response ratio givesan overestimate even with noiseless detection. More generally, with ,A small response-ratio mismatch therefore gives .
The optical reason to check transfer is visible in the primary response theory: different pathways contain different transition-dipole products, and their amplitudes include relaxation factors. Pulse bandwidth, polarization and the selected 2D IR waiting time help determine which response is recorded.[ref]
Frequency-frequency correlation functions and apodization in two-dimensional infrared vibrational echo spectroscopy: A new approach by Kyungwon Kwak and others. §II.A, Eqs. 5–7 and response pathways
This does not establish a universal two-population model for every 2D IR cross peak.A 2D IR response-factor validation mixture supplies independently known composition under the new conditions. Test whether the old response ratio predicts its amplitudes, and repeat over an appropriate composition range if matrix effects or nonlinearity are plausible. Reusing an unknown's fitted fraction to validate the factor that produced it would be circular.
Retain the amplitude definition and phase convention as well as the instrument settings. The phase-controlled peptide experiment measures phases and amplitudes, so a signed or complex component need not obey the positive-component equations above.[ref]
Two-dimensional infrared spectroscopy of peptides by phase-controlled femtosecond vibrational photon echoes by M. C. Asplund and others. Abstract and experimental method, phase matching and heterodyne readout
Successful transfer concerns a specified model and observable, not every intensity visible in a spectrum. 2D IR waiting time 2026-11-05
The 2D IR waiting time is the controlled interval between excitation-related coherence evolution and later detection-related evolution in a two-dimensional infrared spectroscopy pulse sequence. It is often denoted or . Varying it asks how the sample's response changes between preparation and observation; it is distinct from the delays transformed into the two frequency coordinates.
A primary phase-controlled peptide experiment measured vibrational echo phase and amplitude as multiple pulse delays varied, providing a physical implementation of this multidelay spectroscopy.[ref]
Two-dimensional infrared spectroscopy of peptides by phase-controlled femtosecond vibrational photon echoes by M. C. Asplund and others. Abstract, multiple pulse delays and phase-sensitive detection.
The exact meaning of a fitted waiting-time change depends on which response pathways the experiment selects.An original illustrative model separates population loss from growth of a transferred component. Let total observable excited-state population decay as and let a transferred fraction grow as . Stipulate matched response factors and signalsWith and , the cross signal is approximately0.233 at but0.117 at . Meanwhile the transferred fraction increases from0.632 to0.865. A decreasing raw 2D IR cross peak need not imply a decreasing transferred fraction.
Under these particular assumptions, 2D IR population normalization gives . The raw cross signal reaches its maximum atwhich is approximately1.39ps here. This is an explicitly stipulated kinetic example, not a universal normalization rule or an inference of exchange from one peak.
At very short intervals, pulse overlap and coherent effects can matter; at long intervals, vibrational relaxation can leave little signal. Report pulse timing, normalization and the response model when assigning a waiting-time dependence to molecular dynamics.
Martin T. Zanni 2026-11-05
Martin T. Zanni is a chemist developing multidimensional spectroscopy and its applications to molecular structure and dynamics. The University of Wisconsin name/contact on his author-hosted CV agrees with the primary2011 prize-organizer profile, and a primary Optica collaboration record explicitly expands his earlier M. T. byline.[ref]
Martin T. Zanni at the 2011 Sackler Prize in Chemistry. Named profile and linked author CV.
[ref]With M. C. Asplund and Robin M. Hochstrasser, Martin T. Zanni coauthored the phase-controlled peptide two-dimensional infrared spectroscopy experiment. His later first-person lecture account describes developing mid-infrared spectral pulse shaping to generate the required pulse trains under computer control.[ref]
Two-dimensional infrared spectroscopy of peptides by phase-controlled femtosecond vibrational photon echoes by M. C. Asplund and others. Author byline.
[ref]An original acquisition-count example illustrates why control technology matters. Stipulate one acquisition for each pair in a two-delay grid. A grid requires4096 acquisitions; a grid requires65536, sixteen times as many. Averaging, drift and repeat measurements add further demands. Automated timing can make a scientifically useful multidimensional measurement practical, while pulse characterization and controls determine whether the generated sequence matches the intended one.
The calculation is a sampling-design illustration, not an acquisition specification attributed to a particular apparatus. The broader contribution connects instrument control with access to structural and dynamical information that a single-frequency trace can conceal.


M. C. Asplund 2026-11-05
M. C. Asplund is a coauthor of the primary phase-controlled peptide experiment in two-dimensional infrared spectroscopy. The published paper identifies a University of Pennsylvania chemistry affiliation and retains the exact byline M. C. Asplund, alongside M. T. Zanni and R. M. Hochstrasser.[ref]
The joint experiment measured phase and amplitude of vibrational photon echoes and resolved features interpreted as coupling between amide-I modes. It connected controlled pulse delays with information about molecular interactions.[ref]
Two-dimensional infrared spectroscopy of peptides by phase-controlled femtosecond vibrational photon echoes by M. C. Asplund and others. Abstract, coupled modes and phase-sensitive measurement.
An original response-matrix example clarifies the extra question asked by a multidimensional experiment. Consider two stipulated mapsTheir diagonal values agree, while their off-diagonal responses differ. Looking only at the two diagonal amplitudes would miss that difference. These are illustrative spectral-response entries, not quantum density matrices or reported experimental data.
A 2D IR cross peak can supply a constraint on relationships between vibrations, but its cause must be assessed using the signal phase, timing and physical model. M. C. Asplund's verified contribution is coauthorship of that experimental method; the paper does not by itself assign every individual apparatus or analysis task to one coauthor.
Robin M. Hochstrasser 2026-11-05
Robin M. Hochstrasser was a physical chemist working on molecular spectroscopy and dynamics. A primary Optica conference record explicitly gives this full-name spelling in the same coupled-vibrator and infrared-echo collaboration whose papers also use the byline R. M. Hochstrasser.[ref]
With M. C. Asplund and Martin T. Zanni, Robin M. Hochstrasser coauthored the2000 phase-controlled peptide experiment in two-dimensional infrared spectroscopy. It used heterodyne detection to recover phase and amplitude of vibrational photon echoes, rather than measuring only an unsigned signal intensity.[ref]
An original field-addition example explains why phase matters. Two contributions of amplitude1 add to total amplitude2 and intensity4 when in phase; opposite-sign contributions cancel to0. Knowing each separate intensity was1 would not determine the combined result. With a known reference field and weak signal field ,For a sufficiently strong reference, the cross term makes the weak field measurable with sensitivity to its relative phase. Changing reference phase samples different field components.
The spectroscopy's scientific power comes from using those controlled relations to constrain molecular interactions. A measured 2D IR cross peak still requires a response model before it establishes a particular coupling or structural assignment. Coherent detection adds information; it does not remove the need for physical interpretation.
Two-dimensional infrared spectroscopy 2026-11-05
Two-dimensional infrared spectroscopy measures a sample's vibrational response as a function of two frequency coordinates. In a coherent experiment, timed infrared pulses establish an excitation history and a later optical response; the spectrum correlates excitation and detection frequencies. The two dimensions are spectral coordinates, not two spatial directions through the sample.
In a time-domain implementation, the experiment scans a coherence delay and resolves a detection interval while holding a 2D IR waiting time fixed. Schematically, a complex measured response is transformed toThe signs and combination of measured response pathways depend on the experimental convention. Fourier analysis converts the scanned delays into frequency information; it does not by itself establish which molecular mechanism produced a feature.
An original spectral example has modes near and . Features at coordinates and lie on the diagonal. An off-diagonal feature at is a 2D IR cross peak: excitation associated with one coordinate is correlated with response at another. Its physical interpretation depends on the pulse sequence and waiting time. A cross peak is not automatically evidence for chemical conversion between two species.
A primary2000 peptide experiment used phase-controlled femtosecond pulses, phase matching and heterodyne detection to measure the phase and amplitude of vibrational photon echoes as pulse delays varied. Cross peaks in acyl-proline-NH spectra supplied evidence for coupling between amide-I modes, with solvent-sensitive structural differences.[ref]
Compared with a one-dimensional infrared spectroscopy trace, the extra coordinate can separate overlapping responses and expose relationships between vibrations. Varying the 2D IR waiting time adds a controlled time dependence to test candidate mechanisms. Interpretation still requires a response model, sufficient time/frequency resolution and controls for solvent and instrument contributions; a richly structured spectrum does not uniquely determine a molecular structure by inspection.
Vibrational coherence 2026-11-05
Vibrational coherence is a definite phase relationship between components of vibrational motion. In a quantum description, it concerns off-diagonal entries of a density matrix in a specified vibrational energy basis, rather than only the populations of those levels. The basis must be stated because quantum coherence is basis-dependent.
An original two-level illustration compareswith an incoherent mixture . Both have equal quantum state populations, but only the first has a nonzero off-diagonal element. For a displacement operator with real off-diagonal matrix element and zero diagonal elements, its expectation in the pure state is , while the mixture gives zero. Relative phase can therefore affect an observable without changing the populations.
For an ensemble of classical vibrational oscillators, the analogous distinction is between individual motion and the sum of their phases. Oscillators can retain their energies while a spread of phases reduces the net coherent signal. A weak ensemble signal need not mean every molecule has stopped vibrating. Conversely, coherence does not require every possible vibration to have one common phase.
A primary peptide experiment measured phase and amplitude of vibrational photon echoes using optical heterodyne detection. It provides an experimental setting in which phase relationships are observable rather than merely a drawing convention.[ref]
Dephasing and vibrational relaxation describe different aspects of dynamics: losing a phase relationship and changing vibrational populations need not occur at the same rate. Extracting either from a measured trace requires the pulse sequence, detector response and a stated molecular model.
Vibrational photon echo 2026-11-05
A vibrational photon echo is a coherently emitted infrared signal in which a pulse sequence allows contributions from different vibrational frequencies to rephase. It probes vibrational coherence and its loss. Rephasing of optical phase is different from physically reversing a molecular reaction or restoring a lost population.
An original ideal model makes the phase cancellation explicit. Suppose a group of oscillators has angular-frequency offsets distributed with density . A rephasing pathway accumulates phase during an initial interval and during detection. Its static-offset contribution isFor a zero-mean normal distribution of offsets with standard deviation ,At , the offset phases cancel. With stipulated and , the normalized static-offset factor is at and1 at rephasing. This ideal cancellation does not remove other sources of coherence decay or guarantee the same signal shape in a real experiment.
A primary peptide experiment used phase-controlled femtosecond pulses and phase matching to isolate vibrational echoes. Heterodyne detection measured their phase and amplitude, enabling two-dimensional infrared spectroscopy as pulse delays were varied.[ref]
The chosen pathway and pulse geometry matter: not every nonlinear infrared signal is an echo. Comparing delay-dependent amplitudes and phases can separate recoverable frequency dispersion from other dynamical effects, but interpretation needs a response model, pulse characterization and an account of the sample's changing environment.