A Reliability Block Diagram (RBD) is a graphical representation used to analyze the reliability of a system and its components. In an RBD, components of a system are represented as blocks, and the arrangement of these blocks illustrates how the components interact in terms of their reliability. **Key Features of Reliability Block Diagrams:** 1. **Components:** Each block represents an individual component of the system, such as a machine, part, or subsystem.
The Weibull modulus, often denoted as \( m \), is a key parameter in the Weibull distribution, which is commonly used to describe the variability of materials' strengths and failure times. It quantifies the degree of variation in the strength of a material: - A low Weibull modulus (e.g., \( m < 1 \)) indicates a wide spread of strength values and a higher chance of failure, suggesting that some samples may exhibit much lower strength than others.
Magneto can refer to a few different things, depending on the context: 1. **Marvel Comics Character**: Magneto is a fictional character in the Marvel Comics universe, created by writer Stan Lee and artist Jack Kirby. He first appeared in "X-Men" #1 in 1963. Magneto, whose real name is Max Eisenhardt (often known as Erik Lensherr), is a powerful mutant with the ability to manipulate magnetic fields and control metal.
The covariance function, also known as the covariance kernel in the context of stochastic processes, describes how two random variables or functions are related to each other in terms of their joint variability. Specifically, it quantifies the degree to which two variables change together.
Ricardo A. Olea is a prominent figure in the field of geostatistics, which involves the application of statistics to geological and spatial data. He is known for his contributions to various methods in geostatistics, particularly in the context of mineral resource estimation and environmental science. Olea has authored several research papers and books, including work on the practical applications of geostatistical formulas and techniques.
The concept of a "neighbourhood unit" is a planning and urban design framework that emphasizes the design and organization of residential areas to promote community interaction, accessibility, and a sense of belonging. Originally proposed by the urban planner Clarence Perry in the early 20th century, the neighbourhood unit concept is based on several key principles: 1. **Size and Scale**: A neighbourhood unit is typically defined as an area with a population of about 5,000 to 10,000 people.
The Two-Step Floating Catchment Area (2SFCA) method is a spatial analysis technique used in health services research and urban planning to assess accessibility to healthcare services or other amenities. It combines the concepts of "catchment areas" (regions that a service provider can effectively reach) and "floating catchments," which allows for a more dynamic evaluation of service availability considering the proximity and population distribution around healthcare facilities.
A variogram is a fundamental tool in geostatistics used to analyze and model spatial variability or spatial correlation of a variable over an area. It quantifies how the similarity of a spatial process decreases as the distance between data points increases. The variogram is defined as half the average squared difference between paired observations as a function of the distance separating them.
DxOMark is a benchmark that measures the image quality of cameras, smartphone cameras, and lenses. Established in 2008 by a French company, DxO, the platform is well-regarded for its in-depth testing and reviews, which provide ratings based on objective criteria. DxOMark's tests cover various aspects of imaging performance, including: - **Dynamic Range**: The range of light intensities from the darkest shadows to the brightest highlights.
The Fractional Synthetic Rate (FSR) is a measure used in the field of metabolic research, particularly in studies related to protein synthesis and turnover. It represents the rate at which a specific protein is synthesized relative to the total amount of that protein present in the body or tissue at a given time.
Psychometrics is a field of study concerned with the theory and technique of psychological measurement. This includes the assessment of knowledge, abilities, attitudes, personality traits, and other psychological constructs. The goals of psychometrics include developing reliable and valid instruments for measuring these constructs, analyzing the data obtained from these instruments, and interpreting the results.
Vehicular metrics refer to various measurements and performance indicators related to the operation, efficiency, and safety of vehicles. These metrics can be used in different contexts, such as transportation analysis, autonomous vehicle development, fleet management, and environmental impact assessments. Depending on the specific application, vehicular metrics may include: 1. **Fuel Efficiency**: Measurements like miles per gallon (MPG) or liters per 100 kilometers (L/100 km) that indicate how efficiently a vehicle uses fuel.
Environmental indices are numerical values or indicators that quantify and summarize various aspects of environmental conditions, sustainability, and ecological health. They are used to assess, compare, and monitor the quality of the environment across different regions or time periods. These indices often incorporate a variety of environmental, social, and economic factors and are useful tools for policymakers, researchers, and the public to understand ecological trends and make informed decisions.
The Eco-Management and Audit Scheme (EMAS) is a voluntary environmental management tool developed by the European Union. It aims to improve organizations' environmental performance through the implementation of effective management practices. Here are some key aspects of EMAS: 1. **Objectives**: The primary goal of EMAS is to promote continuous environmental performance improvements in organizations while ensuring compliance with environmental legislation.
An environmental indicator is a quantitative measure used to assess the condition of the environment and the health of ecosystems. These indicators provide valuable information about various environmental factors, helping to track changes over time, identify trends, and inform decision-making related to environmental policy, management, and conservation efforts.
Mark and recapture is a scientific technique used to estimate the size of animal populations in ecology. The basic idea is to capture a sample of individuals from a population, mark them in a harmless way, and then release them back into the environment. After allowing some time for the marked individuals to mix back into the population, a second sample is captured. By comparing the ratio of marked to unmarked individuals in the second sample, researchers can use mathematical formulas to estimate the total population size.
Sustainability measurement refers to the process of assessing and quantifying the environmental, social, and economic impacts of actions, policies, and practices to determine their sustainability performance and contributions to sustainable development. It involves using various metrics, indicators, and frameworks to evaluate how well an organization, community, or system is managing resources in a way that meets current needs without compromising the ability of future generations to meet their own needs.
Taylor's law is a statistical principle that describes the relationship between the mean and variance of biological populations. It states that the variance of a population is often proportional to a power of its mean. More formally, if \( S^2 \) represents the variance and \( \mu \) represents the mean of a population, Taylor's law can be expressed as: \[ S^2 = a \mu^b \] where \( a \) and \( b \) are constants.
Pinned article: Introduction to the OurBigBook Project
Welcome to the OurBigBook Project! Our goal is to create the perfect publishing platform for STEM subjects, and get university-level students to write the best free STEM tutorials ever.
Everyone is welcome to create an account and play with the site: ourbigbook.com/go/register. We belive that students themselves can write amazing tutorials, but teachers are welcome too. You can write about anything you want, it doesn't have to be STEM or even educational. Silly test content is very welcome and you won't be penalized in any way. Just keep it legal!
Intro to OurBigBook
. Source. We have two killer features:
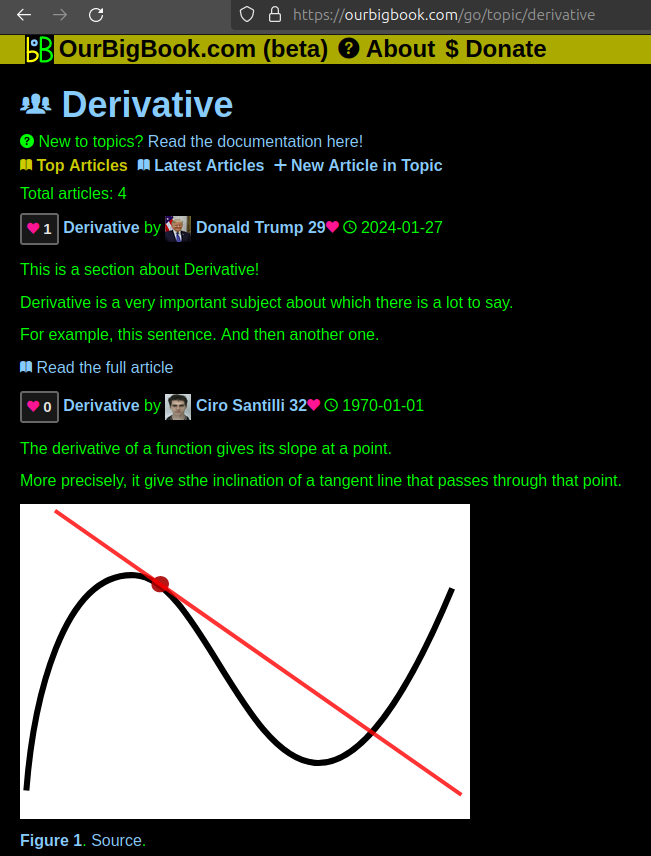
- topics: topics group articles by different users with the same title, e.g. here is the topic for the "Fundamental Theorem of Calculus" ourbigbook.com/go/topic/fundamental-theorem-of-calculusArticles of different users are sorted by upvote within each article page. This feature is a bit like:
- a Wikipedia where each user can have their own version of each article
- a Q&A website like Stack Overflow, where multiple people can give their views on a given topic, and the best ones are sorted by upvote. Except you don't need to wait for someone to ask first, and any topic goes, no matter how narrow or broad
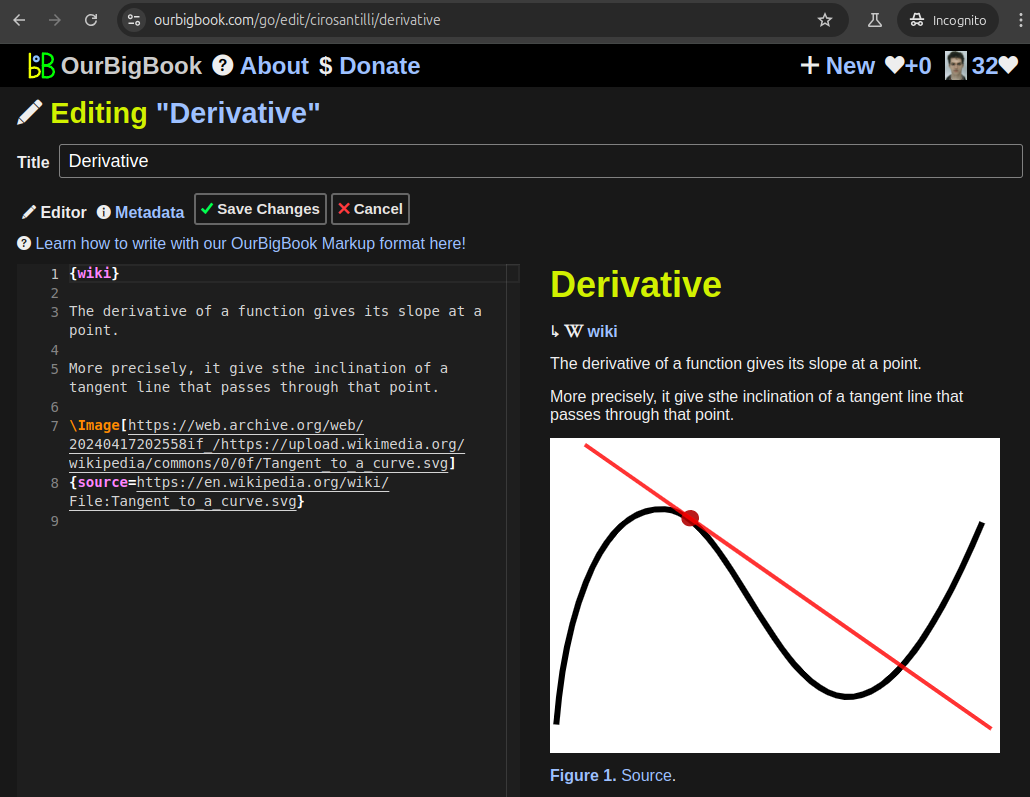
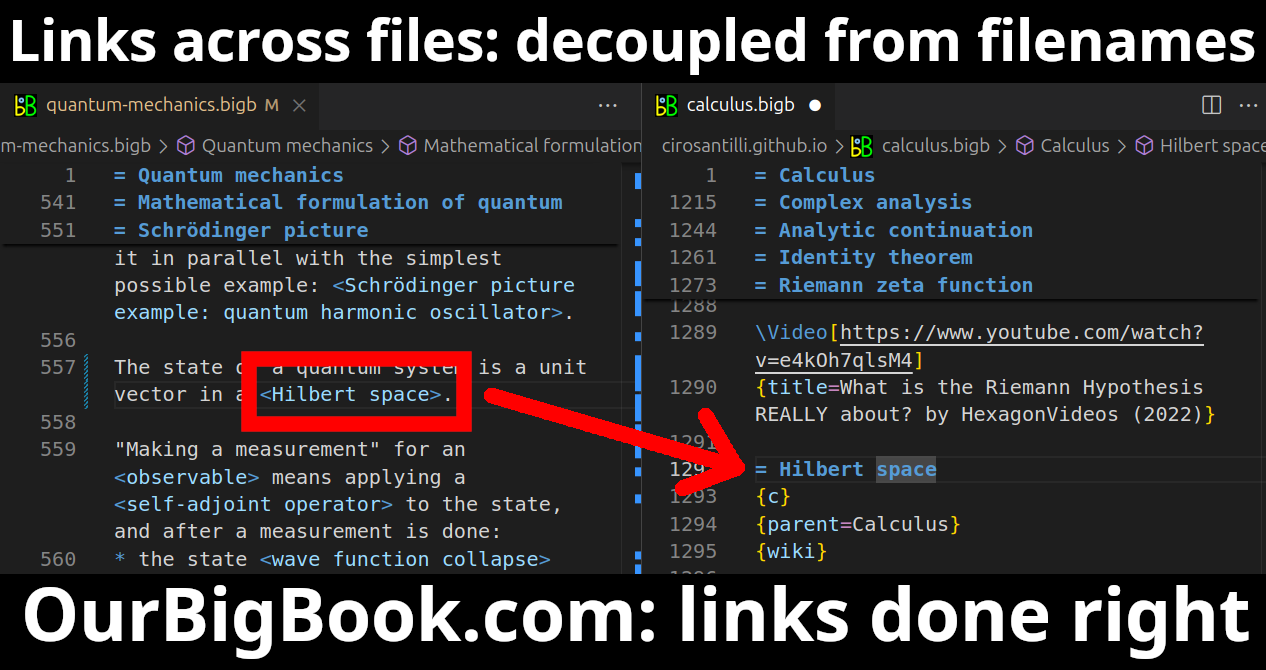
This feature makes it possible for readers to find better explanations of any topic created by other writers. And it allows writers to create an explanation in a place that readers might actually find it.Figure 1. Screenshot of the "Derivative" topic page. View it live at: ourbigbook.com/go/topic/derivativeVideo 2. OurBigBook Web topics demo. Source. - local editing: you can store all your personal knowledge base content locally in a plaintext markup format that can be edited locally and published either:This way you can be sure that even if OurBigBook.com were to go down one day (which we have no plans to do as it is quite cheap to host!), your content will still be perfectly readable as a static site.
- to OurBigBook.com to get awesome multi-user features like topics and likes
- as HTML files to a static website, which you can host yourself for free on many external providers like GitHub Pages, and remain in full control
Figure 2. You can publish local OurBigBook lightweight markup files to either OurBigBook.com or as a static website.Figure 3. Visual Studio Code extension installation.Figure 5. . You can also edit articles on the Web editor without installing anything locally. Video 3. Edit locally and publish demo. Source. This shows editing OurBigBook Markup and publishing it using the Visual Studio Code extension. - Infinitely deep tables of contents:
All our software is open source and hosted at: github.com/ourbigbook/ourbigbook
Further documentation can be found at: docs.ourbigbook.com
Feel free to reach our to us for any help or suggestions: docs.ourbigbook.com/#contact


