Topics (203k) Articles (205k) Users (300) Discussions (237) Comments (383) Files (715) New article

The Ogden tables, also known as the "Ogden Injury Tables," are a set of statistical tables used in the field of personal injury litigation in the United Kingdom. Developed by the mathematician and actuary Sir Michael Ogden, the tables provide a tool for calculating the future financial losses of individuals who have suffered injuries, particularly in cases where their ability to work and earn a salary may be impaired.
The Office of the Chief Actuary (OCA) is a component of the U.S. Social Security Administration (SSA) responsible for providing actuarial analysis and advice related to the Social Security program. Its primary functions include: 1. **Actuarial Evaluations**: The OCA conducts regular evaluations of the financial status of the Social Security Trust Funds. This includes assessing the program's ability to pay future benefits and determining the long-term sustainability of Social Security.
Multi-attribute global inference of quality is a concept often utilized in decision-making, quality assessment, and evaluation processes. While the term itself may not be widely recognized as a standard framework in any specific field, it suggests a systematic approach to evaluating and inferring the quality of entities (which may include products, services, or systems) based on multiple attributes.
Mortality rate is a measure used to quantify the number of deaths in a specific population within a certain time period, usually expressed per 1,000 or 100,000 individuals. It helps in assessing the overall health of a population and can be used to analyze trends in public health, the effectiveness of healthcare systems, and the impact of various diseases.
Mortality forecasting is the process of predicting future mortality rates within a population. This practice is vital for various fields, including public health, insurance, and demography, as it helps to estimate life expectancy, plan for healthcare needs, allocate resources, and assess the financial stability of pension and insurance systems. The purpose of mortality forecasting can include: 1. **Public Health Planning**: Governments and health organizations use mortality forecasts to allocate healthcare resources and design public health programs to improve population health.
Model risk refers to the potential for a financial institution or organization to incur losses due to errors in model development, implementation, or use. This risk arises when the models used for decision-making—such as risk assessment, pricing, forecasting, and portfolio management—do not accurately represent the real-world processes they are intended to emulate.
Medical underwriting is the process used by insurance companies to evaluate the health status and medical history of an individual applying for health or life insurance coverage. This process helps insurers determine the level of risk associated with insuring a particular individual and to decide on the terms of coverage, including premiums, exclusions, and policy limitations.
Measuring Attractiveness by a Categorical-Based Evaluation Technique (MACBETH) is a method used for multi-criteria decision analysis (MCDA). This technique helps decision-makers evaluate and compare the attractiveness of various options based on qualitative and quantitative criteria. The primary aim of MACBETH is to transform qualitative assessments into a quantitative scale that allows for meaningful comparisons.
The maximum lifespan refers to the longest period that an individual member of a species can live under optimal conditions, without the influence of environmental hazards, diseases, or other factors that could cause premature death. It is a theoretical limit to lifespan, as opposed to life expectancy, which is the average lifespan of a population based on current mortality rates.
Maximum Downside Exposure refers to the largest potential loss an investor could face in a financial investment under adverse conditions. This concept is commonly used in risk management and finance to evaluate the worst-case scenario for an investment or trading strategy. In practical terms, it helps investors understand how much they could potentially lose if the market moves against them. This measure is crucial for making informed decisions regarding investment strategies, portfolio construction, and risk management.
Mathematical statistics is a branch of mathematics that focuses on the theory and methodology of statistical analysis. It combines mathematical theories and tools with statistical principles to understand and analyze data. The main components of mathematical statistics include: 1. **Probability Theory**: This provides the foundational framework for making inferences from data. It involves studying random variables, probability distributions, expectations, and various convergence concepts (such as convergence in distribution, probability, and mean).
Loss reserving is a crucial practice in the insurance industry that involves estimating the amount of money an insurance company must set aside to pay for claims that have been incurred but not yet settled (IBNR), as well as those that have been reported but not yet paid. This process is essential for ensuring that an insurer remains solvent and can fulfill its future obligations to policyholders.
The Loss Development Factor (LDF) is a key concept in actuarial science and insurance, particularly in the context of reserving and claims management. It helps insurers estimate the future loss amounts for claims that have already been reported but are not yet fully settled. The LDF is used to project the ultimate losses for a given accident year based on the loss experience observed up to different points in time.
Longevity risk refers to the potential financial risk that arises from individuals living longer than expected. This risk is particularly relevant in contexts such as pensions, insurance, and retirement planning. Here are some key points about longevity risk: 1. **Definition**: Longevity risk is the risk that people will outlive their financial resources due to an increase in life expectancy. This can impact both individuals and financial institutions.
A list of fictional actuaries includes characters from various forms of media such as books, television shows, and films that identify as actuaries or are portrayed as working in actuarial science. While actuaries are not as commonly featured in popular culture as other professions, here are a few notable examples: 1. **Lester Nygaard** - A character from the television series "Fargo," who is depicted as an insurance salesman and mathematician, incorporating themes relevant to actuarial science.
A life table is a demographic tool used to analyze and summarize the mortality rates and life expectancy of a population. It provides a systematic way to describe the mortality experience of a cohort (a group of individuals) or the entire population by presenting data on the likelihood of death at various age intervals. ### Key Components of a Life Table: 1. **Age Intervals**: The table is divided into age intervals (usually in years), which can be grouped (e.g.
Life expectancy is a statistical measure that estimates the average number of years a person can expect to live, based on demographic factors such as current age and sex, as well as historical mortality rates. It is commonly used to assess the overall health and longevity of populations and can vary significantly between different countries, regions, and demographic groups due to factors like healthcare access, lifestyle, economic conditions, and environmental influences.
A life annuity is a financial product that provides regular payments to an individual for the duration of their life. It is often used as a way to ensure a stable income stream during retirement. Here are some key features of life annuities: 1. **Payment Structure**: Upon purchase, the individual typically makes a lump sum payment (the premium) to an insurance company or financial institution. In return, they receive periodic payments, which can be monthly, quarterly, or annually.
A Liability-Driven Investment (LDI) strategy is an investment approach typically employed by institutional investors, such as pension funds and insurance companies, to align their investment portfolios with their future liabilities. The primary goal of LDI is to ensure that the assets will be sufficient to meet the future obligations of the institution (such as pension payouts or insurance claims) as they come due.
A Lexis diagram is a graphical representation used in demography and epidemiology to visualize the relationship between age, period, and cohort. It helps researchers analyze how different cohorts (groups of individuals born in the same time period) experience various life events, such as births, deaths, or illnesses, over time. The diagram typically consists of: - **Horizontal axis:** Represents time or calendar years (the period). - **Vertical axis:** Represents age.
Pinned article: Introduction to the OurBigBook Project
Welcome to the OurBigBook Project! Our goal is to create the perfect publishing platform for STEM subjects, and get university-level students to write the best free STEM tutorials ever.
Everyone is welcome to create an account and play with the site: ourbigbook.com/go/register. We belive that students themselves can write amazing tutorials, but teachers are welcome too. You can write about anything you want, it doesn't have to be STEM or even educational. Silly test content is very welcome and you won't be penalized in any way. Just keep it legal!
Intro to OurBigBook
. Source. We have two killer features:
- topics: topics group articles by different users with the same title, e.g. here is the topic for the "Fundamental Theorem of Calculus" ourbigbook.com/go/topic/fundamental-theorem-of-calculusArticles of different users are sorted by upvote within each article page. This feature is a bit like:
- a Wikipedia where each user can have their own version of each article
- a Q&A website like Stack Overflow, where multiple people can give their views on a given topic, and the best ones are sorted by upvote. Except you don't need to wait for someone to ask first, and any topic goes, no matter how narrow or broad
This feature makes it possible for readers to find better explanations of any topic created by other writers. And it allows writers to create an explanation in a place that readers might actually find it.
Figure 1. Screenshot of the "Derivative" topic page. View it live at: ourbigbook.com/go/topic/derivativeVideo 2. OurBigBook Web topics demo. Source. - local editing: you can store all your personal knowledge base content locally in a plaintext markup format that can be edited locally and published either:This way you can be sure that even if OurBigBook.com were to go down one day (which we have no plans to do as it is quite cheap to host!), your content will still be perfectly readable as a static site.
- to OurBigBook.com to get awesome multi-user features like topics and likes
- as HTML files to a static website, which you can host yourself for free on many external providers like GitHub Pages, and remain in full control
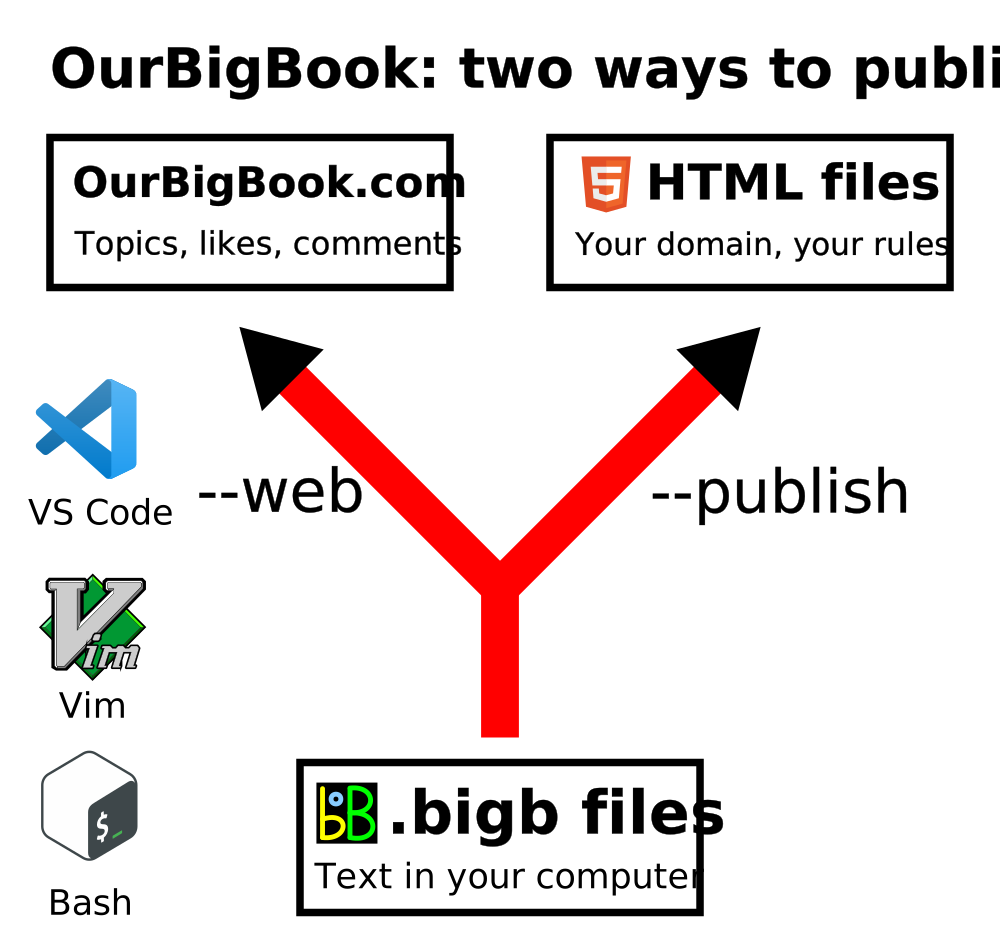
Figure 2. You can publish local OurBigBook lightweight markup files to either OurBigBook.com or as a static website.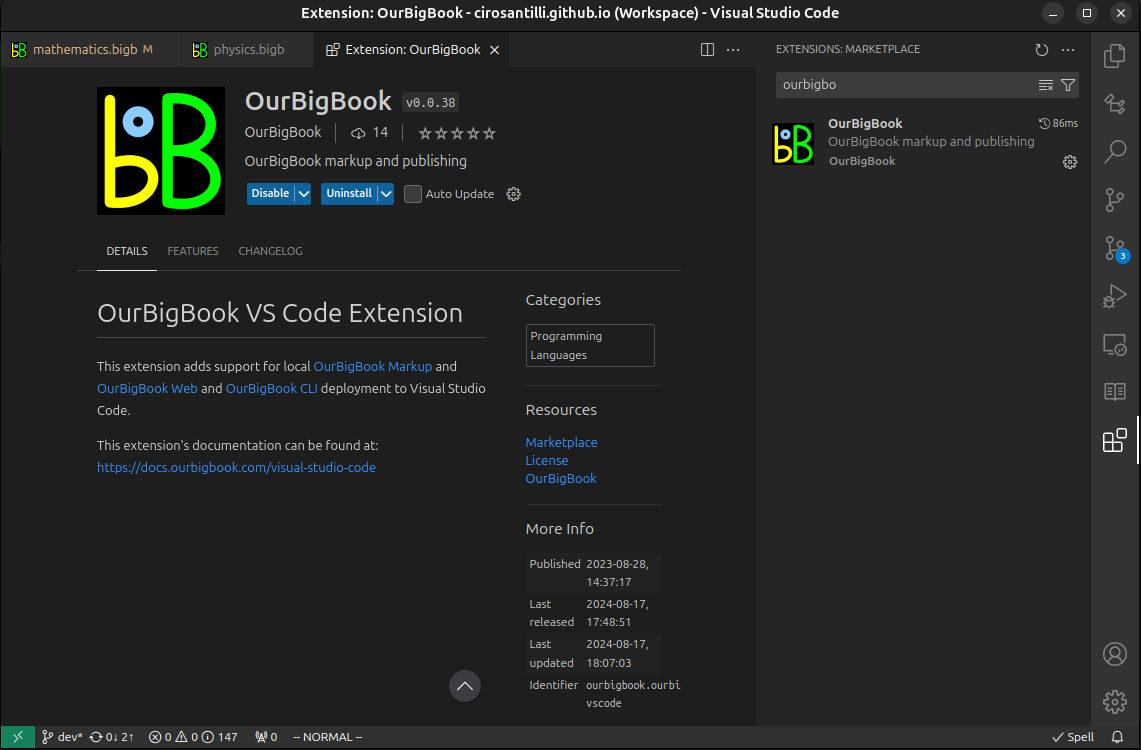
Figure 3. Visual Studio Code extension installation.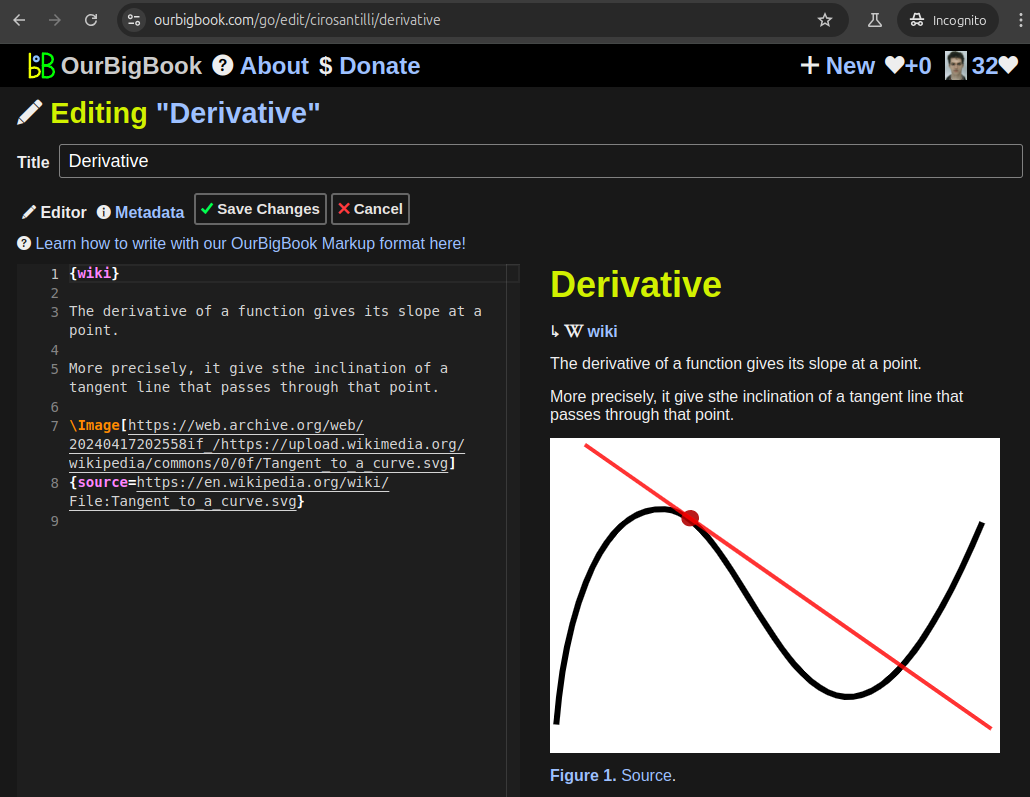
Figure 5. . You can also edit articles on the Web editor without installing anything locally. Video 3. Edit locally and publish demo. Source. This shows editing OurBigBook Markup and publishing it using the Visual Studio Code extension. 
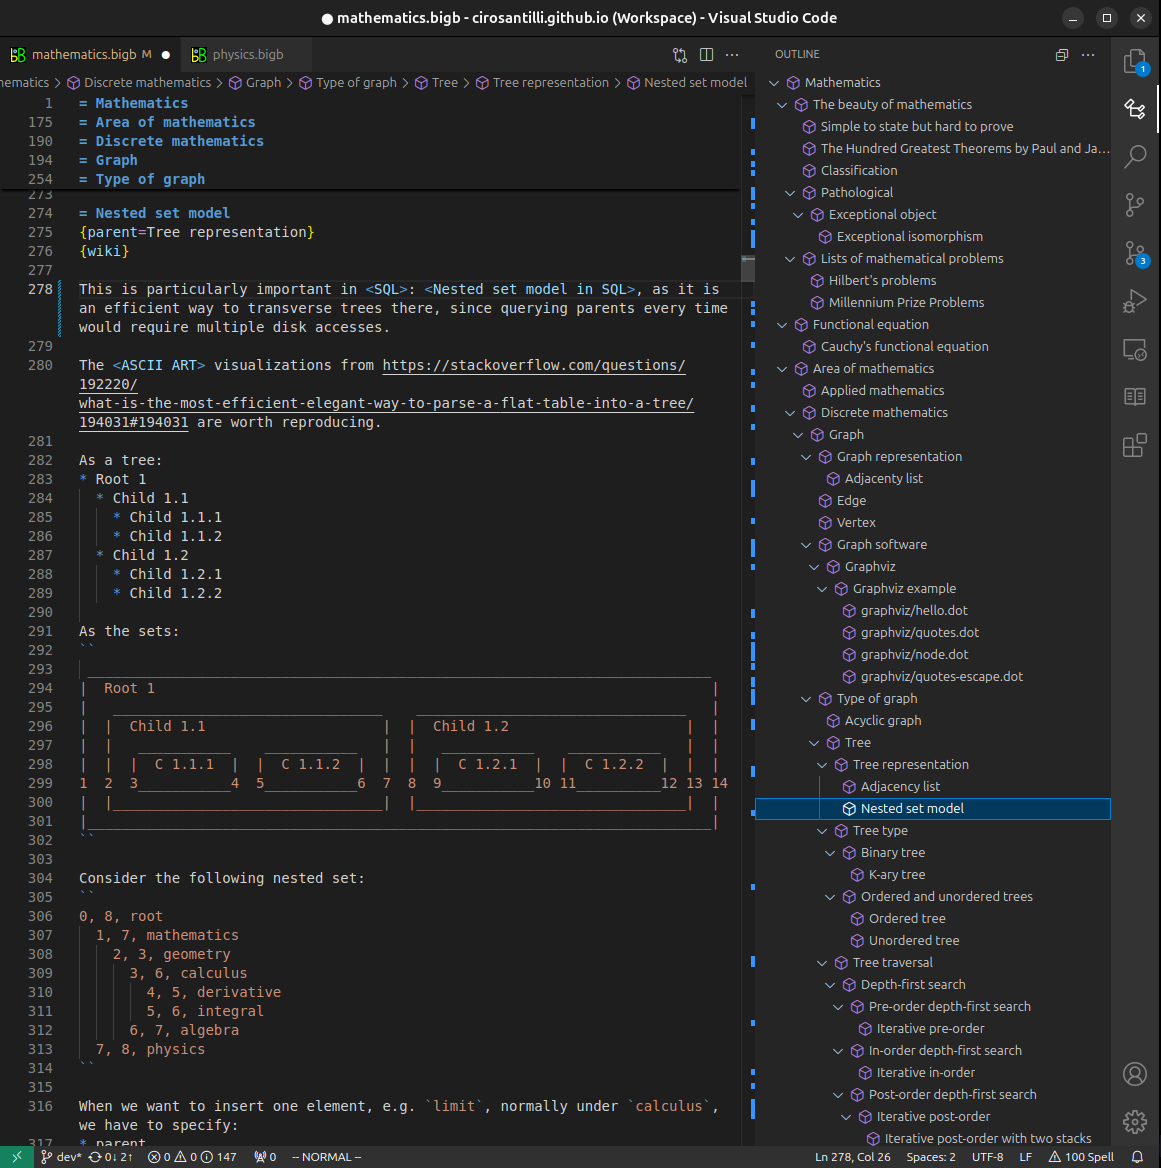
- Infinitely deep tables of contents:

All our software is open source and hosted at: github.com/ourbigbook/ourbigbook
Further documentation can be found at: docs.ourbigbook.com
Feel free to reach our to us for any help or suggestions: docs.ourbigbook.com/#contact