Gaussian regression toward the mean
ID: gaussian-regression-toward-the-mean

Take the original synthetic model and , mutually independent random variables, with the second argument denoting variance. The pair has a multivariate normal distribution with mean zero, unit marginal variances, and Pearson correlation coefficient . Its conditional multivariate normal distribution isFor a first reading , the second reading has conditional expectation and conditional variance , hence standard deviation . There is still conditional probability of , a movement farther from zero, where is the standard normal distribution function. The line describes a conditional mean, not an individual trajectory.
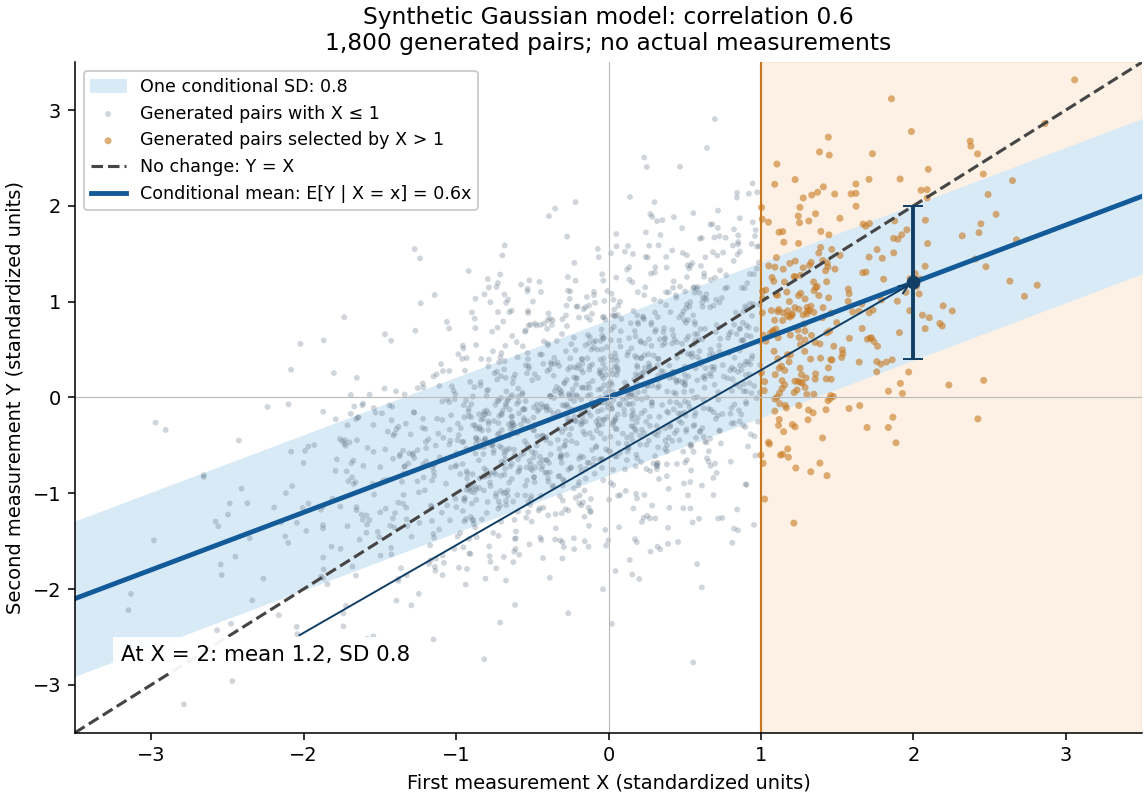

A short derivation isolates . Its covariance with is zero and its variance is . Because has a multivariate normal distribution, zero covariance implies independence: independently of . This also explains why reversing the two measurements gives . The statistical association does not identify a direction of causal effect.
New to topics? Read the docs here!