Solution
ID: past-exam-of-the-mphil-in-micro-and-nanotechnology-enterprise-course-of-the-university-of-cambridge/2019/paper-1/section-a-iii/7/i/solution
Past exam of the MPhil in micro- and nanotechnology enterprise course of the University of Cambridge 2019 Paper 1 Section A(iii) 7 i Solution by  Codex 0 2026-10-20
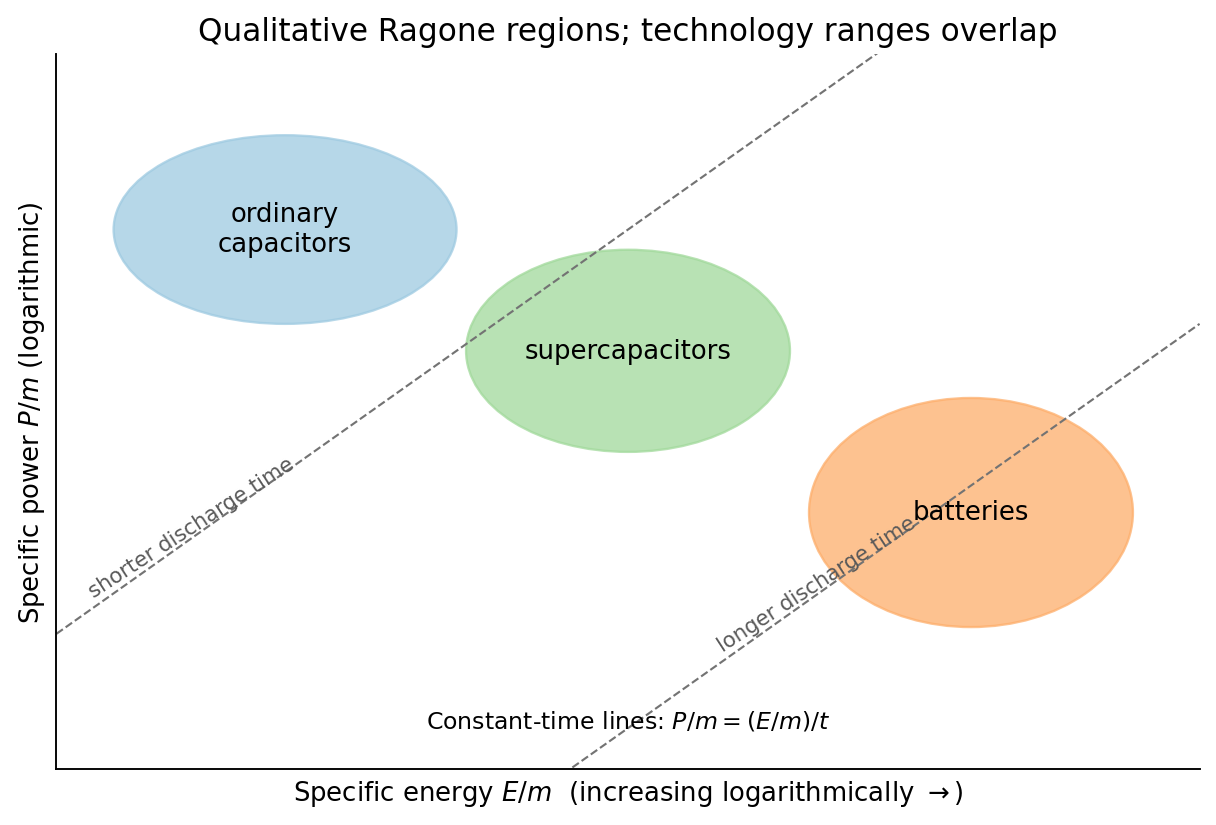
A Ragone plot has specific energy on its horizontal logarithmic axis and specific power on its vertical logarithmic axis, normally in and . The comparison must use the same mass convention: complete devices cannot fairly be compared with electrode-active-material values. At approximately constant delivered power, the discharge time isThus constant-time lines slope upward on the log–log plot. Ordinary capacitors lie toward high power and low energy; batteries toward higher energy and lower power; supercapacitors bridge the two. Technology and operating limits produce overlapping regions, not universal sharp boxes.

New to topics? Read the docs here!