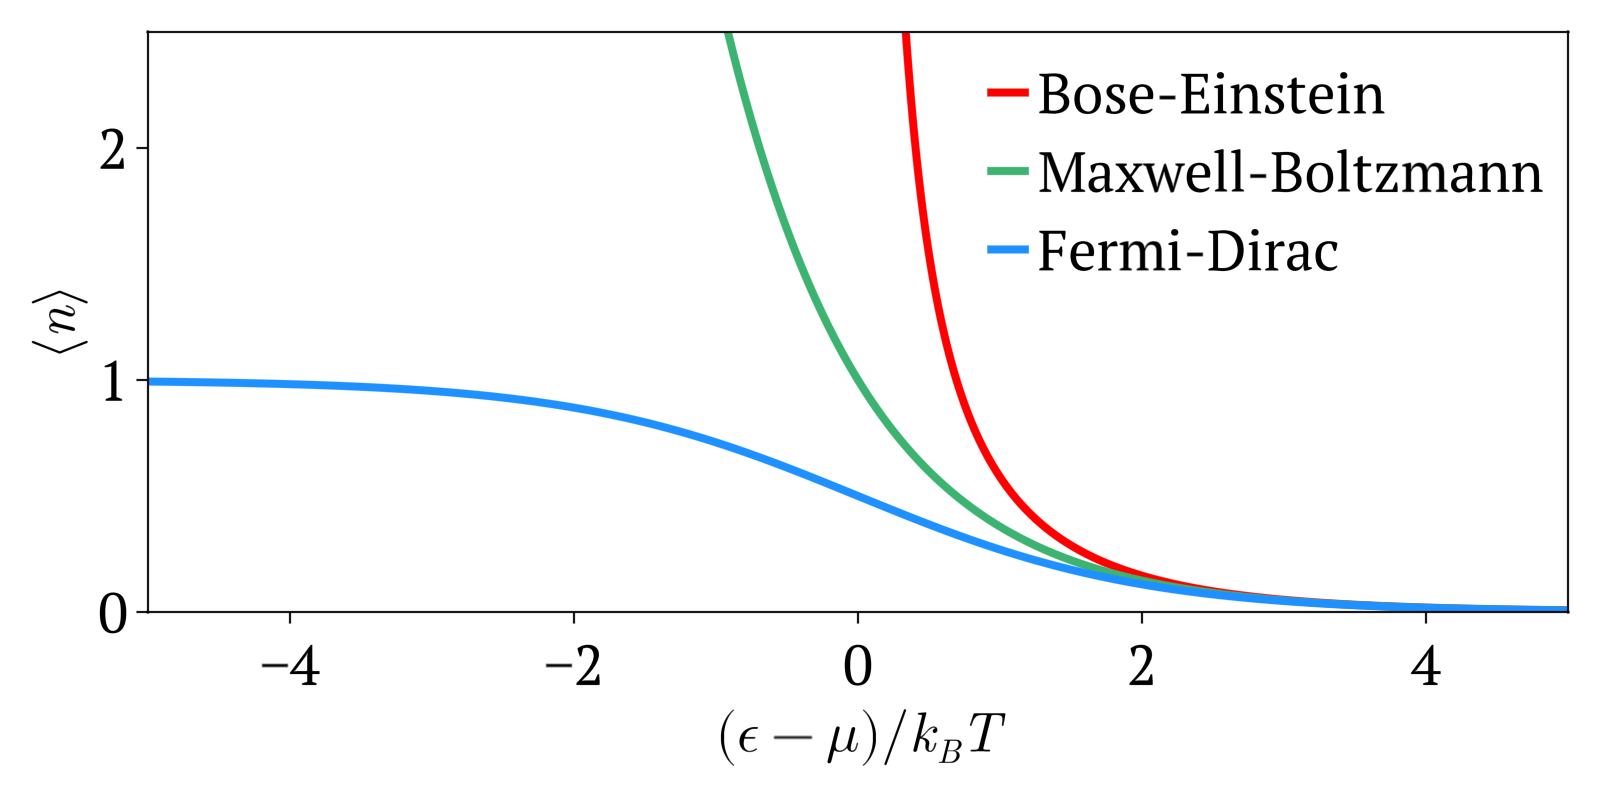
Maxwell-Boltzmann statistics, Bose-Einstein statistics and Fermi-Dirac statistics all describe how energy is distributed in different physical systems at a given temperature.
For example, Maxwell-Boltzmann statistics describes how the speeds of particles are distributed in an ideal gas.
The temperature of a gas is only a statistical average of the total energy of the gas. But at a given temperature, not all particles have the exact same speed as the average: some are higher and others lower than the average.
For a large number of particles however, the fraction of particles that will have a given speed at a given temperature is highly deterministic, and it is this that the distributions determine.
One of the main interest of learning those statistics is determining the probability, and therefore average speed, at which some event that requires a minimum energy to happen happens. For example, for a chemical reaction to happen, both input molecules need a certain speed to overcome the potential barrier of the reaction. Therefore, if we know how many particles have energy above some threshold, then we can estimate the speed of the reaction at a given temperature.
The three distributions can be summarized as:
- Maxwell-Boltzmann statistics: statistics without considering quantum statistics. It is therefore only an approximation. The other two statistics are the more precise quantum versions of Maxwell-Boltzmann and tend to it at high temperatures or low concentration. Therefore this one works well at high temperatures or low concentrations.
- Bose-Einstein statistics: quantum version of Maxwell-Boltzmann statistics for bosons
- Fermi-Dirac statistics: quantum version of Maxwell-Boltzmann statistics for fermions. Sample system: electrons in a metal, which creates the free electron model. Compared to Maxwell-Boltzmann statistics, this explained many important experimental observations such as the specific heat capacity of metals. A very cool and concrete example can be seen at youtu.be/5V8VCFkAd0A?t=1187 from Video "Using a Photomultiplier to Detect single photons by Huygens Optics" where spontaneous field electron emission would follow Fermi-Dirac statistics. In this case, the electrons with enough energy are undesired and a source of noise in the experiment.
A good conceptual starting point is to like the example that is mentioned at The Harvest of a Century by Siegmund Brandt (2008).
Consider a system with 2 particles and 3 states. Remember that:
- in quantum statistics (Bose-Einstein statistics and Fermi-Dirac statistics), particles are indistinguishable, therefore, we might was well call both of them
A, as opposed toAandBfrom non-quantum statistics - in Bose-Einstein statistics, two particles may occupy the same state. In Fermi-Dirac statistics
Therefore, all the possible way to put those two particles in three states are for:
- Maxwell-Boltzmann distribution: both A and B can go anywhere:
- Bose-Einstein statistics: because A and B are indistinguishable, there is now only 1 possibility for the states where A and B would be in different states.
- Fermi-Dirac statistics: now states with two particles in the same state are not possible anymore:
Maxwell-Boltzmann distribution for three different temperatures
. Most applications of the Maxwell-Boltzmann distribution confirm the theory, but don't give a very direct proof of its curve.
Here we will try to gather some that do.
Measured particle speeds with a rotation barrel! OMG, pre electromagnetism equipment?
- bingweb.binghamton.edu/~suzuki/GeneralPhysNote_PDF/LN19v7.pdf
- chem.libretexts.org/Bookshelves/Physical_and_Theoretical_Chemistry_Textbook_Maps/Book%3A_Thermodynamics_and_Chemical_Equilibrium_(Ellgen)/04%3A_The_Distribution_of_Gas_Velocities/4.07%3A_Experimental_Test_of_the_Maxwell-Boltzmann_Probability_Density
edisciplinas.usp.br/pluginfile.php/48089/course/section/16461/qsp_chapter7-boltzman.pdf mentions
- sedimentation
- reaction rate as it calculates how likely it is for particles to overcome the activation energy
Bibliography:
Articles by others on the same topic
There are currently no matching articles.

