A crash pulse is an acceleration time history associated with a collision. It must specify a measurement location, direction and reference frame: a vehicle structure, test platform and supported component can have different histories. NASA's 1981 aircraft-seat study explicitly described crash pulses as deceleration time histories and used them to inform crashworthiness testing.[ref]
For one-dimensional motion, the signed area under the acceleration curve is the change in velocity:Consider two original ideal stopping pulses, both lasting and reducing velocity from to zero. A constant pulse needs . A symmetric triangular pulse that begins and ends at zero needs a peak magnitude of , because its area is half its peak times its duration:They have the same average acceleration but different peaks and different time histories.
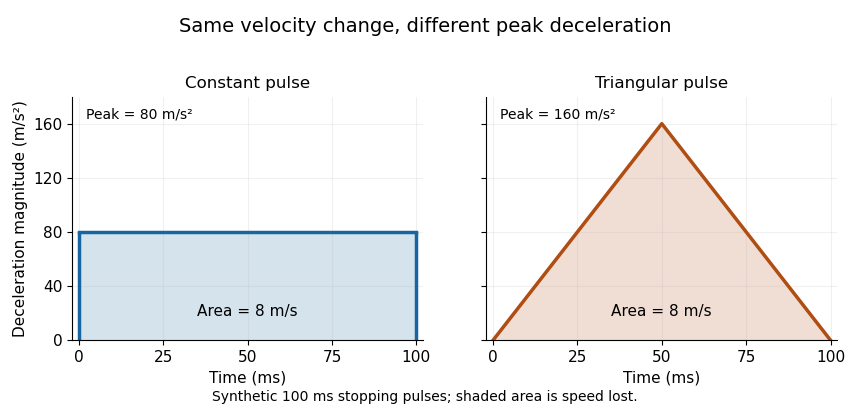

For a constant mass following either prescribed history, Newton's second law gives the same total impulse, , while the peak net force magnitude is for the constant pulse and for the triangular pulse. Equal pulse area therefore does not imply equal peak loading. Component motion can also differ from the motion prescribed at its support because of mechanical compliance and dynamic response.
As a historical apparatus example, the NASA study analyzed twelve light-aircraft crash tests and conducted two vertical drop tests with an energy-absorbing seat prototype at and peak deceleration, where denotes standard gravity. Those test conditions are distinct from the synthetic example above.[ref]
Determination of crash test pulses and their application to aircraft seat analysis by E. Alfaro-Bou and others. Author abstract: twelve crash tests and two vertical drop tests
Articles by others on the same topic
There are currently no matching articles.