Use the complete supplied three-level model, including collisions between levels 2 and 3. Put , , , and denote a collisional rate coefficient by . Detailed balance givesAt , the supplied collision strengths give, in ,The rounded optical wavelengths set the excitation energies; treating the fine splitting as very small compared with changes none of the main conclusions.
Let , , and . Statistical equilibrium for the upper levels isEliminating yields the line-ratio formulaThe same ratio holds for integrated intensities when the two lines sample the same optically thin volume and differential extinction is negligible. Inserting the data gives the particularly simple numerical formThe low- and high-density limits are approximately and . The collisional loss channels giveThus the useful density range is around –. Maximizing for the rational expression gives its strongest fractional sensitivity at . Omitting the supplied 3–2 collisions would change the critical densities and inferred density appreciably.
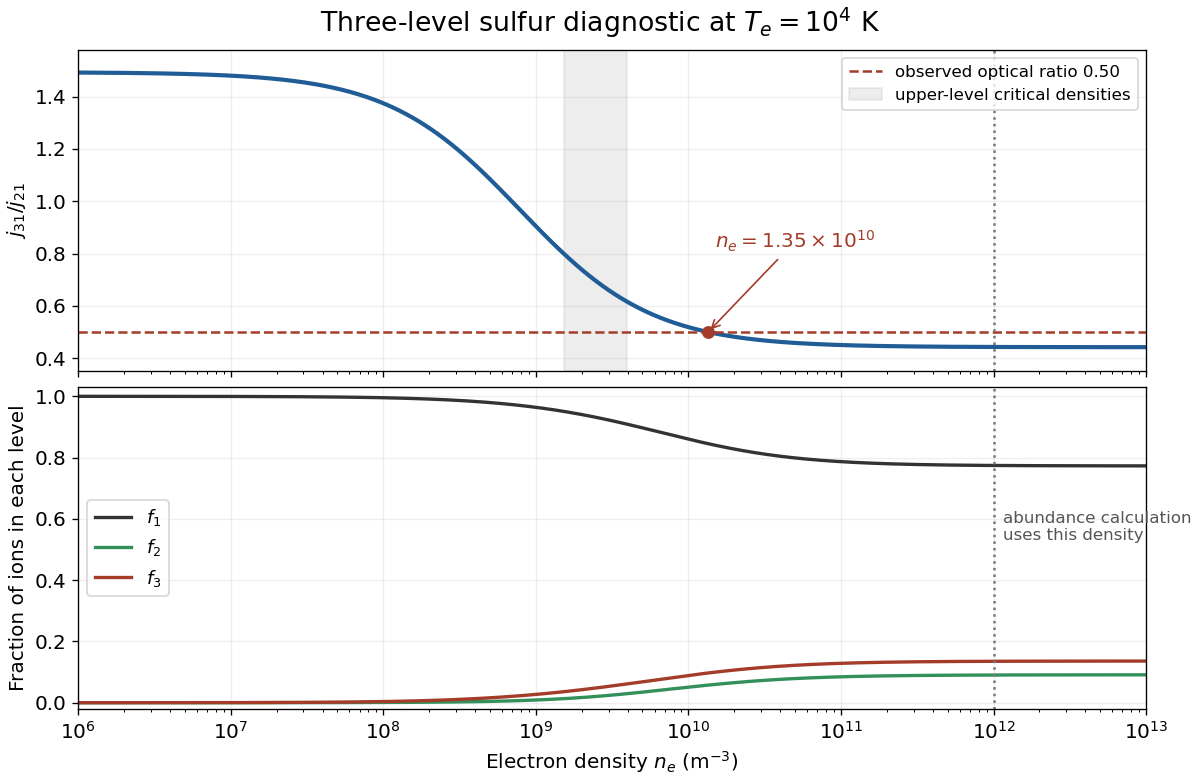
For the observed ratio , inversion gives . This is on the high-density side of the transition, but is not the infinite-density limit. Solving the statistical-equilibrium equations and imposing gives the level fractionsA rough high-density estimate would instead use ; it is useful as a limiting check, not an exact solution for .
For the separate abundance calculation, use the expressly prescribed . The same model now gives , nearly the collisional Boltzmann limit. The measured angle-integrated volume emissivity givesThereforeThis is an abundance per free electron; it is approximately for predominantly ionized hydrogen with . No factor is inserted because the supplied emissivity is power per volume, not power per volume per steradian. The imposed predicts a ratio about , rather than exactly ; the two numerical instructions cannot both describe one uniform zone exactly within this model.
The source's configuration label is a typographical error for the sulfur valence configuration . This does not alter the stated values or the calculation above.[ref]
Energy Levels of Singly Ionized Sulfur by National Institute of Standards and Technology. Ground 4S and low 2D levels: 3s2 3p3 configuration, J values and energy ordering

Articles by others on the same topic
There are currently no matching articles.