Assume all contributing decay rates satisfy and the summed expression is a nonnegative density. ThenThus normalizes the first-passage distribution. A zero decay rate would require separate treatment of a nonabsorbing component; eventual absorption is implicit here. Individual spectral coefficients need not all be positive, but the full density must be.
For an unnormalized representation, divide the first moment by its total mass. Integration by parts givesConsequentlyFor normalized amplitudes the denominator is one. A mode with small weight can still dominate the mean if its lifetime is sufficiently large; this distinction matters when interpreting the later graph.
The observed statistic is the conditional mean among passages completed before , not a mean in which unfinished trajectories are assigned duration . Its normalization isFor each contribution,Dividing the weighted sum of these first moments by givesThe denominator records the fraction of trajectories actually observed to finish.
Set . Expanding gives and . The numerator contribution is therefore and the denominator contribution is .
For one mode, cancellation yieldsThe curve rises monotonically from zero, initially with slope , and rounds towards a horizontal plateau. On logarithmic axes its short-time slope is one. The crossover occurs at observation times of order .
A disconnectivity graph joins minima when an energy threshold first permits a path between their basins. Taking thresholds in steps of 2 and admitting transition states with energy at most the threshold gives the following merges:
These eight merges connect all nine minima without duplicating a basin. Minimum endpoints lie at their stated energies; branch heights are the discretized superbasin thresholds, not necessarily the exact saddle energies. If a strictly-less-than threshold convention is used, barriers exactly on a grid line join at the next grid level; the physical connectivity is unchanged.
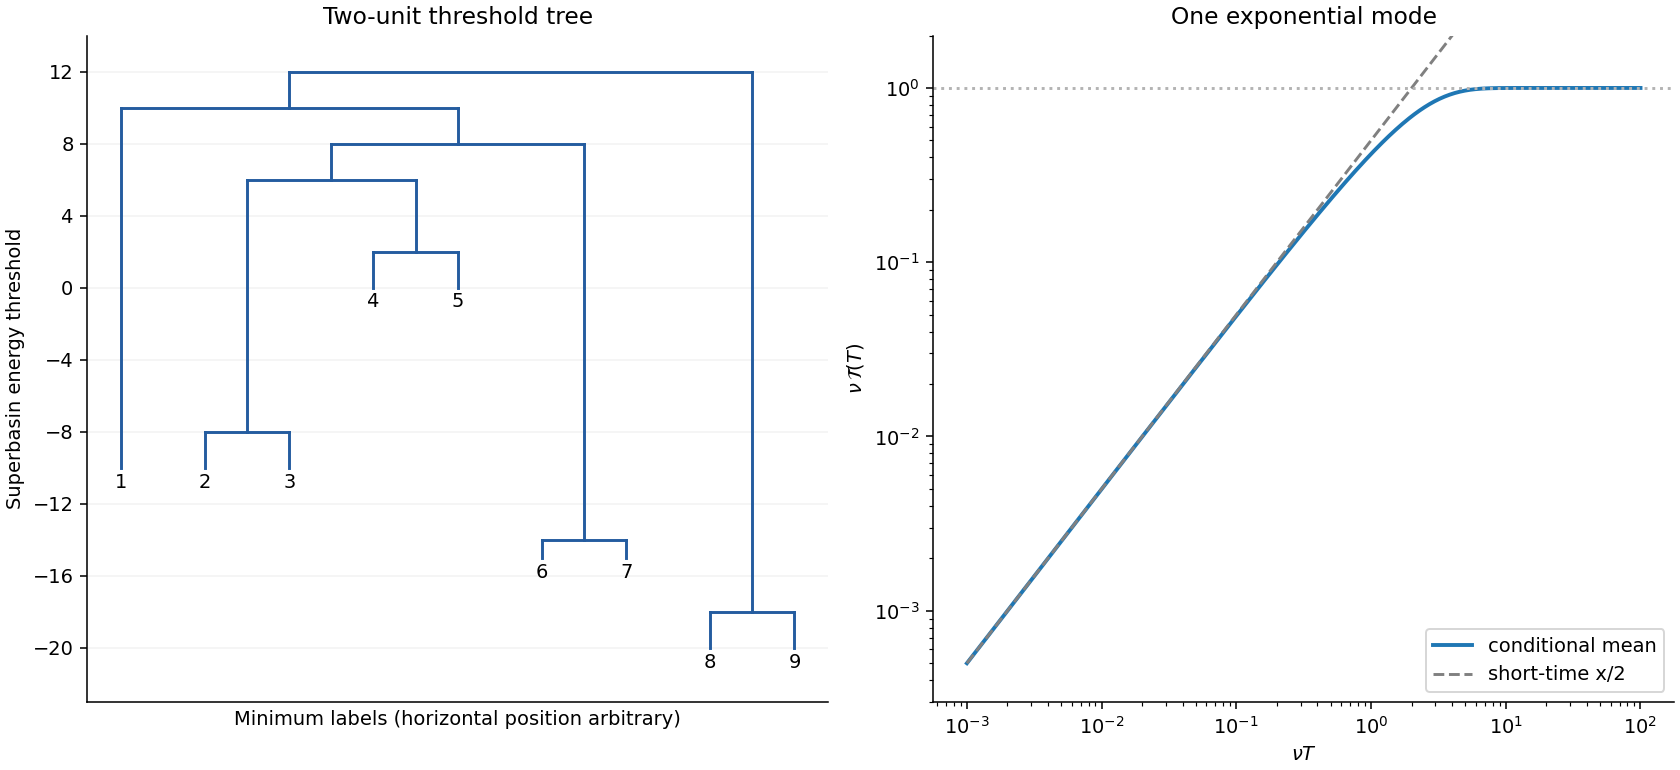
Original disconnectivity tree with two-unit superbasin thresholds and single-mode observation-time crossover
. Details. 
The initial slope near one is the short-observation regime . Successively longer observations include trajectories that enter progressively longer-lived traps before reaching the absorbing minimum. The four marked shoulders represent successive relaxation timescales, not four distinct equilibrium phases. A plateau appears when the contributing faster modes have largely completed but the next slow component has not yet substantially changed the conditional mean. The ultimate plateau is the true mean first-passage time, approximately in the plotted time units.
To estimate a rate, locate the rounding timescale at which that mode stops growing with the observation window, using ; the final completion of a crossover requires several lifetimes. Graphical transitions lie approximately around , 23, 29 and 35, giving only order-of-magnitude estimatesThese are roughly , , and , with factors of several uncertainty from reading broad crossovers. Plateau heights are weighted sums divided by completed probability, not individually ; in particular the final plateau at does not require the slowest lifetime to be . The table fixes barriers and basin connectivity, but supplies no temperature or attempt-frequency convention that would justify exact rates directly from the energies.
Articles by others on the same topic
There are currently no matching articles.