Plot the entire stated interval:
import matplotlib.pyplot as plt

x_grid = np.linspace(-4, 4, 1500)
plt.plot(x_grid, f(x_grid))
plt.xlabel("x")
plt.ylabel("f(x)")
plt.show()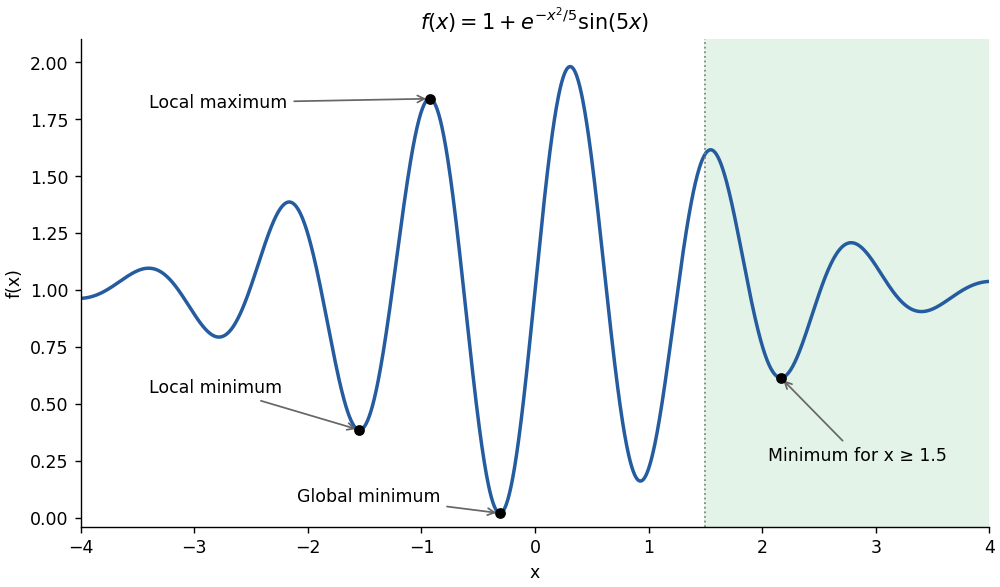
Local extrema, the global minimum and the constrained minimum of the oscillatory objective
. Details. 
Articles by others on the same topic
There are currently no matching articles.