Use fractions of all farms, so and . Assume farm size is fixed, contacts mix randomly, infectious periods have size-independent exponential mean , and the farm-size distribution has finite moments and . Write . The farm-size stratified SIR model with susceptibility proportional to size isHere includes the common contact-rate constant; using frequency-dependent mixing avoids introducing an extra total-farm factor. An infectious farm of any size generates infections in initially susceptible size- farms. The next-generation matrix has rank one, giving the basic reproduction numberThe comparison SIR model replaces every size by , so it has the same basic reproduction number and the same initial exponential growth rate .
As the epidemic develops, put . For negligible initial infection, . Large farms leave the susceptible class faster. If with , differentiation givesThe mean size of newly infected farms is , larger than the susceptible mean unless all sizes agree. If , thenRecovery cancels from this equation because its rate is size-independent. Starting with representative infectives, initially rises toward the size-biased mean ; later depletion of large susceptible farms lowers and usually lowers . It is incorrect to assert that the mean size of infectives must decrease from every possible initial condition. In the growing linearized mode, , so its mean is already .
The aggregate growth equation is . The falling susceptible mean adds a depletion effect absent from the homogeneous SIR model. The final size relation for an epidemic, with vanishing initial seed and attack fraction , isBy Jensen's inequality, the right side is at most , so is no larger than the homogeneous attack fraction. For a common small representative seed the illustrated epidemic is flatter and infects fewer farms; exact pointwise ordering of infected fractions for every time and arbitrary initial seed is not a consequence of equality of .
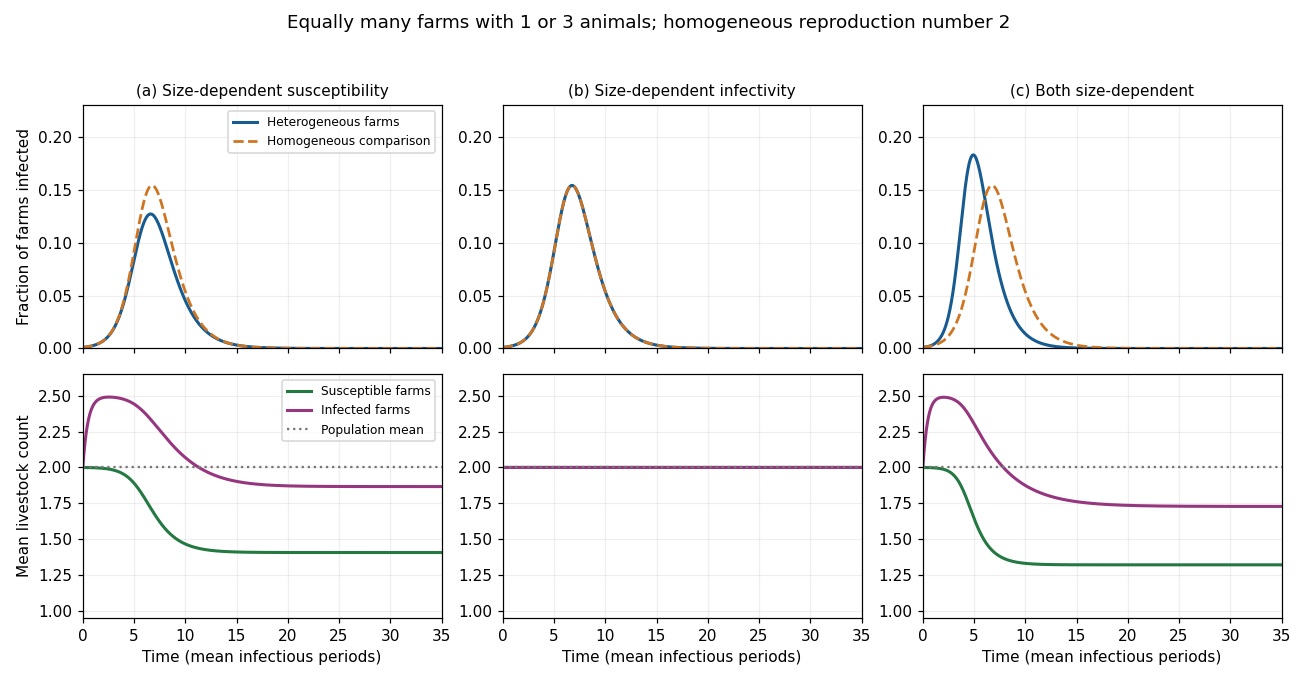
Farm-size heterogeneity: epidemic prevalence and mean livestock counts for the three transmission assumptions
. Details. 
The original sketch uses equally many farms of sizes 1 and 3, recovery rate , and a representative infected seed of . Each homogeneous comparison has . The left, middle and right columns correspond to parts (a), (b) and (c). The top row shows infected farm fractions, and the bottom row distinguishes the mean sizes of susceptible and infected farms. These are illustrative trajectories under the stated model, not universal empirical outbreak curves.
Articles by others on the same topic
There are currently no matching articles.