A frailty model represents unobserved heterogeneity in susceptibility by a positive latent frailty random variable . In the proportional frailty model, conditional on , the individual hazard is , where is a baseline hazard function. If , the conditional survivor function isLarge frailty gives earlier events on average. Normalizing separates the frailty scale from that of the baseline hazard.
The unheaded final request follows for an arbitrary survival mixture, not only this proportional model. Let a randomly selected individual's type be , with individual survivor function and hazard . The population survivor function is . Where differentiation under the expectation is justified, givesThis proves the population hazard of a survival mixture formula: the weights are the individual probabilities of still surviving, normalized to sum or integrate to one. For a finite equally weighted population it becomes . Generally it is not the unweighted average of the original individual hazards. In a proportional frailty model, the frailty distribution among survivors is proportional to times the original frailty distribution.
The population survivor function is the probability that a randomly selected person, averaging over their unobserved frailty, has not experienced the event by time . Here the conditional hazard is constant, so the conditional survival is . For , the uniform frailty density equals one on its interval, giving the uniform frailty survival mixtureAt its continuous extension is , since the numerator is . This is the Laplace transform of the uniform frailty density at argument . It is not : averaging individual survivor functions does not equal exponentiating the mean hazard. If , every individual hazard is zero and .
At time zero there has been no survival selection, so the population hazard of a survival mixture is the original mean individual hazard:At very large times, surviving individuals overwhelmingly come from the smallest-frailty end of the distribution. Their hazards approach the lower endpoint , soFor a direct check, differentiating the logarithm of the uniform frailty survival mixture givesIts expansion at zero is , and its large-time limit is . The changing population hazard does not imply that an individual's hazard declines. The decreasing population hazard under constant individual hazards identity makes the selection mechanism precise: with ,It follows by differentiating the ratio . Thus the surviving mixture becomes less frail over time even though every conditional hazard is constant.
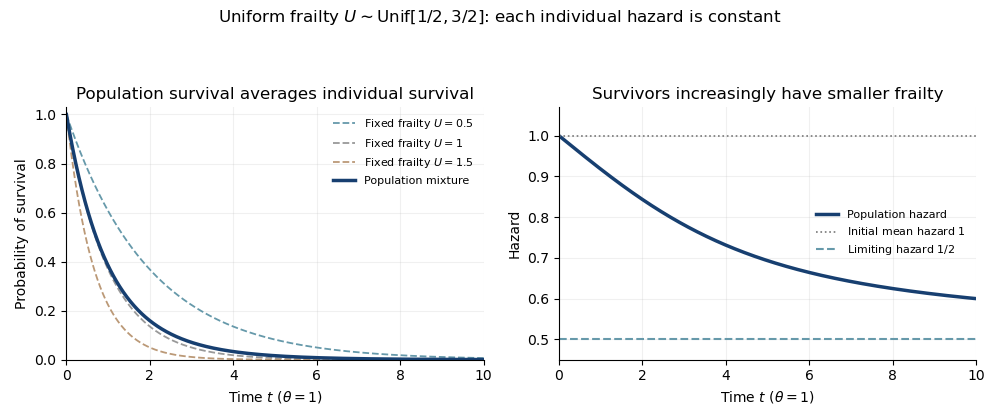
Uniform frailty survival mixture and declining population hazard despite constant individual hazards
. Details. 
The figure takes . The population survivor curve averages conditional exponential curves, while its hazard falls from the initial mean to the minimum individual hazard.
Articles by others on the same topic
There are currently no matching articles.