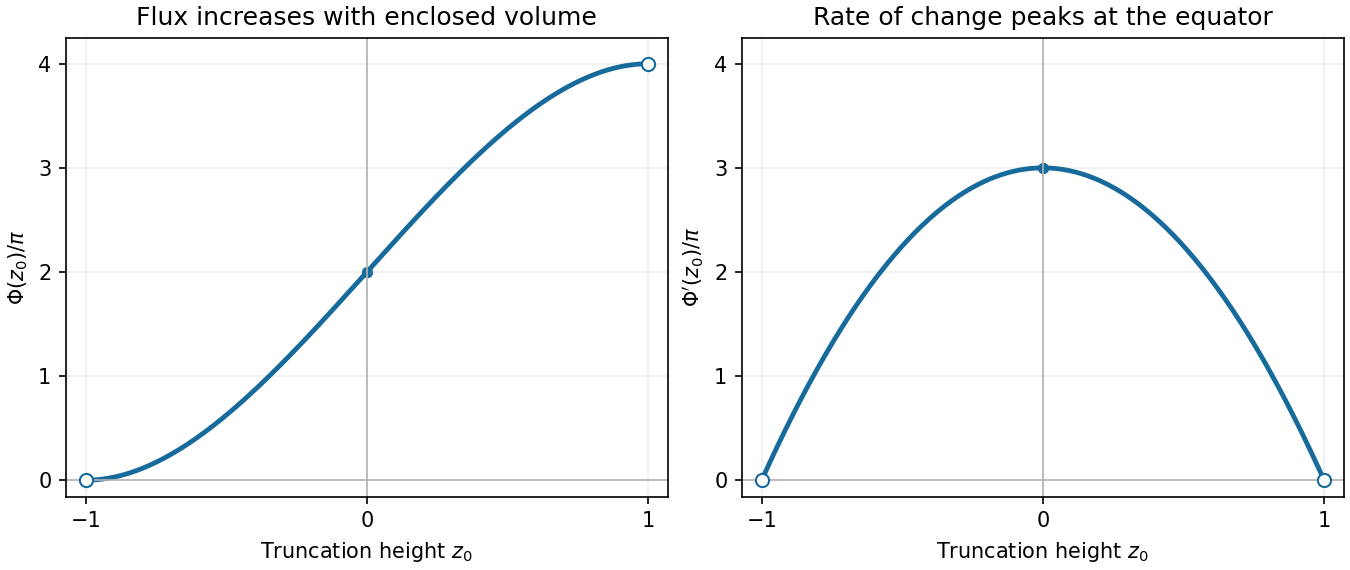
Differentiate the flux:On , is strictly increasing. Its limiting endpoint values are and , and . It has horizontal limiting tangents at the endpoints, curves upward for , curves downward for , and has an inflection point at zero.
The derivative graph is a downward-opening parabola, approaching zero at both endpoints and attaining its maximum at .

Articles by others on the same topic
There are currently no matching articles.