The recorded profile has approximately 30 nm deep, flat-bottomed depressions with broadened, sloping edges. The full-height regions are the inorganic surface; the lower plateaux are the infiltrated perovskite structure. With adequate feedback control, imaging trace and retrace should agree when plotted against the same laboratory position.
The tip has a finite opening angle. Its flank contacts a pore rim before its apex can follow an ideal vertical wall, so tip convolution makes a narrow depression appear narrower and its sidewall less steep. For a flank angle measured from the vertical, the horizontal distance needed to descend a height is . Along the cantilever, the nominal front and back values giveThus the two edges can have different apparent slopes. Across the cantilever, the nominal side angle instead gives about nm on each side. The scan orientation relative to the cantilever must therefore be specified before choosing the relevant pair of slopes.
Even a 100 nm wide pore leaves ample room for the tip apex to reach a flat bottom: in the along-cantilever idealization its bottom plateau is about nm wide. A 200 nm pore gives about 178 nm. The tip height is far greater than the 30 nm step, so it does not prevent access. An unreported finite apex radius adds edge rounding; its size cannot be inferred from the listed flank angles.
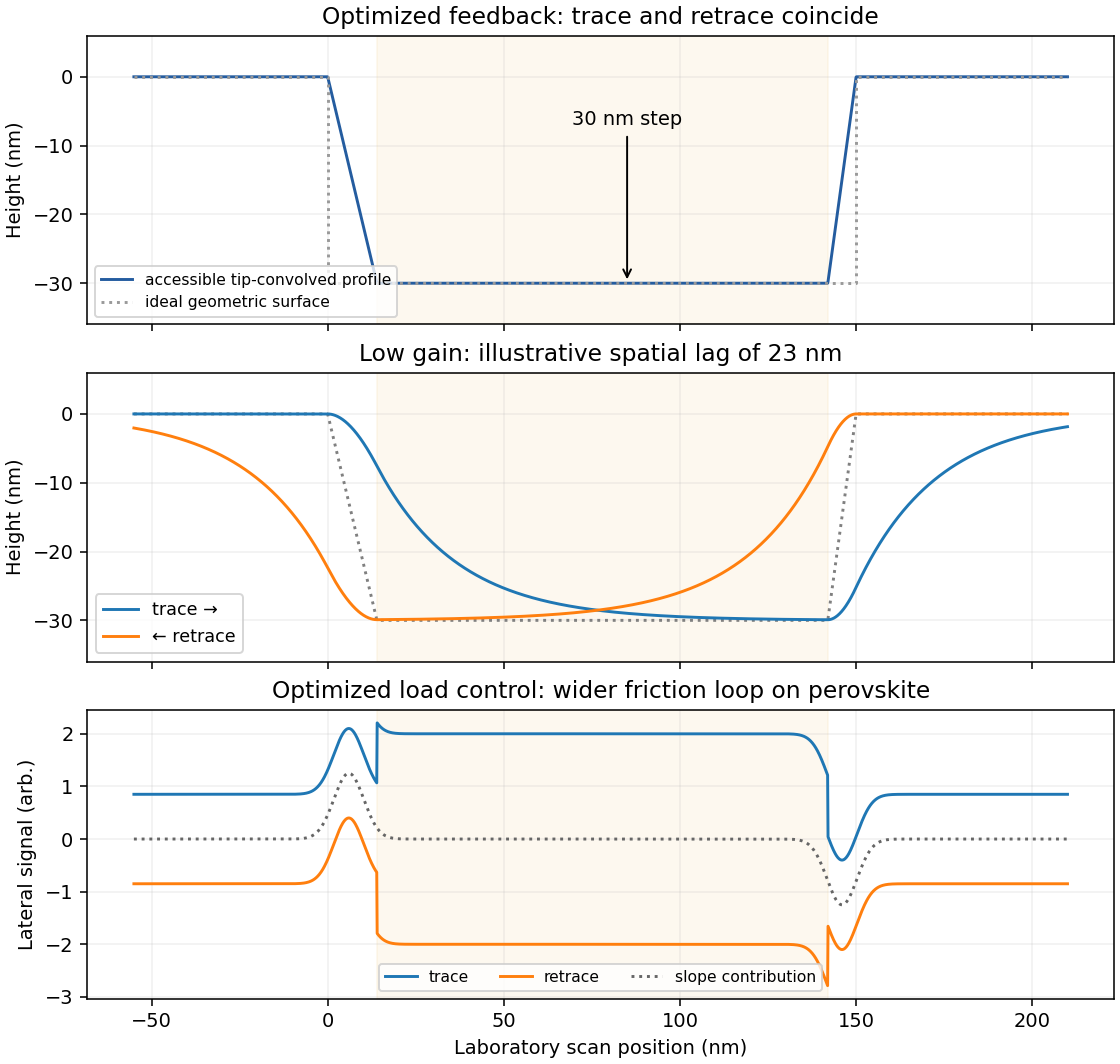

Reducing the feedback gain increases the distance traveled before the vertical actuator responds to a change in height. A simple illustrative response iswhere is the accessible, tip-convolved profile and is the recorded actuator height. At scan speed , the characteristic spatial lag is .
On a left-to-right trace, descent into a pore is late: the tip initially remains too high and may lose contact. At the opposite rim it also rises late, increasing the contact force before the actuator catches up. The lower plateau may be shortened or not reached, making the depression appear too shallow. The whole response is displaced towards larger .
On the right-to-left retrace the same temporal lag produces the opposite displacement in laboratory coordinates. Descent is now delayed at the right-hand edge and ascent at the left-hand edge. imaging trace and retrace separate most strongly near height changes, with opposite spatial shifts and rounded transitions. The central low-gain curves in the figure show this behavior on common axes. Reduced gain alone does not require oscillatory ringing; the first-order lag already explains the principal difference.
friction force microscopy records cantilever torsion caused by lateral tip–sample force. Choose the detector sign so that friction on a flat region contributes positively during a left-to-right trace. On a common laboratory-position axis, write the two signals schematically asHere is an offset and represents a slope-related lateral-force or detector cross-talk contribution. A reversed electronic convention reverses all plotted signs without changing the physical conclusions.
At the same controlled normal contact force , the flat-region contribution is approximately . The lower perovskite structure plateaux give a larger trace–retrace separation than the upper inorganic surface, because their coefficient of kinetic friction is larger. Genuine friction reverses sign with scan direction, so a larger friction magnitude means a higher positive trace and a more negative retrace in this convention.
Sloped edges produce additional peaks or shoulders. The normal reaction to a slope has a lateral component, and the finite tip flank can contact the rim, so edge contrast is not a direct map of the local friction coefficient. With the two scans registered and load control maintained,The half-difference therefore emphasizes friction while the half-sum diagnoses common geometrical contributions. Real contact mechanics and imperfect registration can prevent exact cancellation. The bottom panel of the figure shows these two kinds of contrast separately.
Articles by others on the same topic
There are currently no matching articles.