The recorded profile has approximately 30 nm deep, flat-bottomed depressions with broadened, sloping edges. The full-height regions are the inorganic surface; the lower plateaux are the infiltrated perovskite structure. With adequate feedback control, imaging trace and retrace should agree when plotted against the same laboratory position.
The tip has a finite opening angle. Its flank contacts a pore rim before its apex can follow an ideal vertical wall, so tip convolution makes a narrow depression appear narrower and its sidewall less steep. For a flank angle measured from the vertical, the horizontal distance needed to descend a height is . Along the cantilever, the nominal front and back values giveThus the two edges can have different apparent slopes. Across the cantilever, the nominal side angle instead gives about nm on each side. The scan orientation relative to the cantilever must therefore be specified before choosing the relevant pair of slopes.
Even a 100 nm wide pore leaves ample room for the tip apex to reach a flat bottom: in the along-cantilever idealization its bottom plateau is about nm wide. A 200 nm pore gives about 178 nm. The tip height is far greater than the 30 nm step, so it does not prevent access. An unreported finite apex radius adds edge rounding; its size cannot be inferred from the listed flank angles.
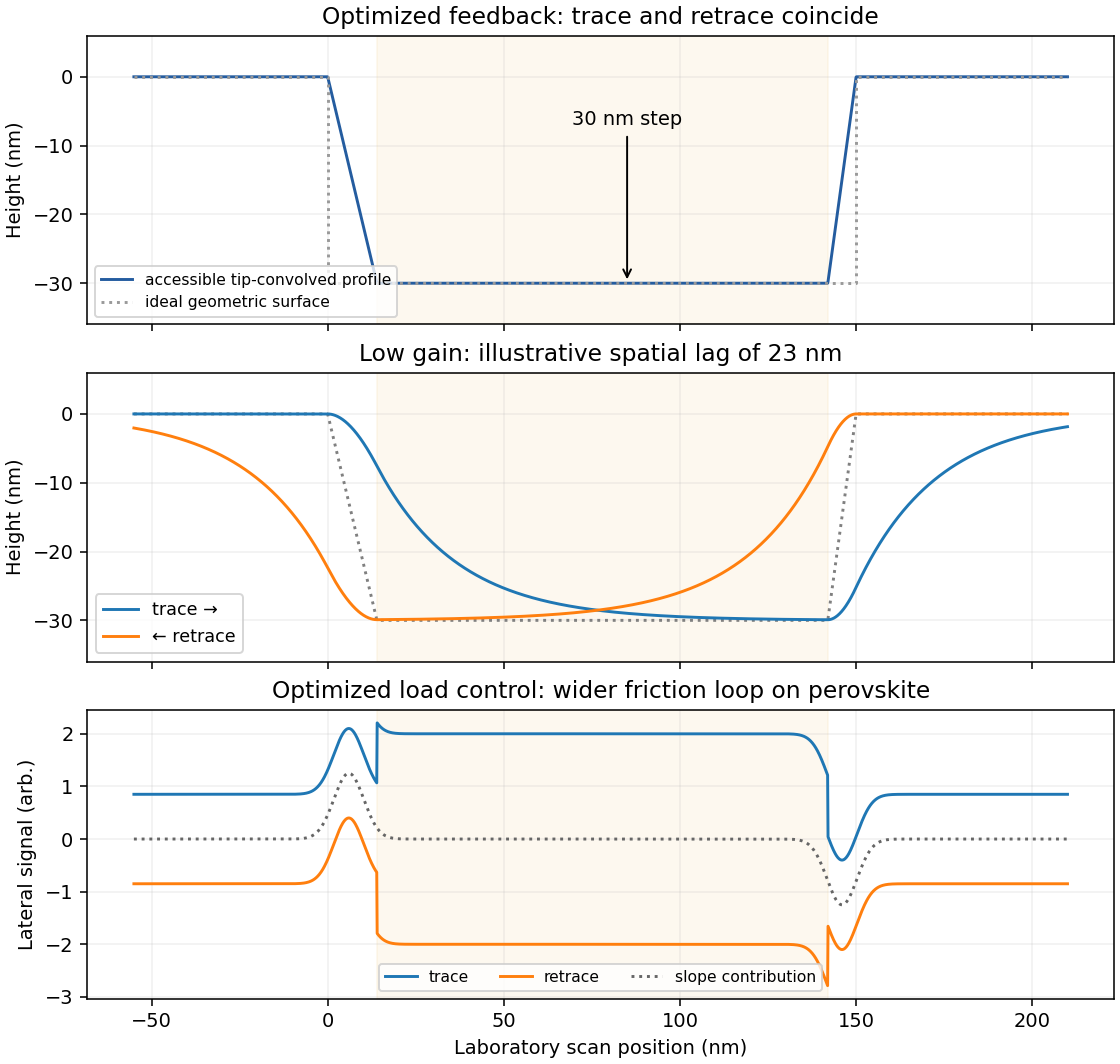
Reducing the feedback gain increases the distance traveled before the vertical actuator responds to a change in height. A simple illustrative response iswhere is the accessible, tip-convolved profile and is the recorded actuator height. At scan speed , the characteristic spatial lag is .
On a left-to-right trace, descent into a pore is late: the tip initially remains too high and may lose contact. At the opposite rim it also rises late, increasing the contact force before the actuator catches up. The lower plateau may be shortened or not reached, making the depression appear too shallow. The whole response is displaced towards larger .
On the right-to-left retrace the same temporal lag produces the opposite displacement in laboratory coordinates. Descent is now delayed at the right-hand edge and ascent at the left-hand edge. imaging trace and retrace separate most strongly near height changes, with opposite spatial shifts and rounded transitions. The central low-gain curves in the figure show this behavior on common axes. Reduced gain alone does not require oscillatory ringing; the first-order lag already explains the principal difference.
friction force microscopy records cantilever torsion caused by lateral tip–sample force. Choose the detector sign so that friction on a flat region contributes positively during a left-to-right trace. On a common laboratory-position axis, write the two signals schematically asHere is an offset and represents a slope-related lateral-force or detector cross-talk contribution. A reversed electronic convention reverses all plotted signs without changing the physical conclusions.
At the same controlled normal contact force , the flat-region contribution is approximately . The lower perovskite structure plateaux give a larger trace–retrace separation than the upper inorganic surface, because their coefficient of kinetic friction is larger. Genuine friction reverses sign with scan direction, so a larger friction magnitude means a higher positive trace and a more negative retrace in this convention.
Sloped edges produce additional peaks or shoulders. The normal reaction to a slope has a lateral component, and the finite tip flank can contact the rim, so edge contrast is not a direct map of the local friction coefficient. With the two scans registered and load control maintained,The half-difference therefore emphasizes friction while the half-sum diagnoses common geometrical contributions. Real contact mechanics and imperfect registration can prevent exact cancellation. The bottom panel of the figure shows these two kinds of contrast separately.
Deposit a dilute dispersion onto a clean, electron-transparent TEM support and let the ethanol evaporate. A practical sequence is to redisperse gently, dilute enough to reduce overlap, place a small drop on a holey or lacey support grid, wick away excess liquid and dry thoroughly. Choose support chemistry compatible with wetting by ethanol.
Look for flakes spanning support holes, where no support film obscures the light-element lattice. Adjacent supported regions help locate and stabilize the flakes. Dilution reduces accidental multilayer stacks, while a clean grid and clean solvent reduce hydrocarbon background. Gentle agitation may be useful; prolonged aggressive sonication can itself change the defects one intends to measure.
Drying prevents a volatile liquid from entering the microscope vacuum. Additional cleaning must be chosen cautiously because heating or energetic plasma treatment can alter oxygen groups and defects in reduced graphene oxide. Record a low-dose survey before atomic-resolution imaging, and distinguish pre-existing defects from changes induced during acquisition.
Use low-voltage, preferably aberration-corrected HRTEM, with about 60–80 kV as a defensible operating range. An approximately 80 kV starting point balances useful lattice resolution against carbon displacement damage; use the lower end if the instrument still resolves the lattice and defect stability is the priority.
A higher accelerating voltage reduces the electron wavelength, but can remove carbon atoms by knock-on displacement. Measurements on pristine single-layer graphene show a strong increase in displacement probability above the vicinity of 80 kV, so simply selecting a conventional 200–300 kV setting is a poor way to preserve the original lattice.[ref]
Accurate Measurement of Electron Beam Induced Displacement Cross Sections for Single-Layer Graphene by Jannik C. Meyer and others. Beam-energy dependence of displacement cross sections, Physical Review Letters 108, 196102
reduced graphene oxide is already defective and chemically modified. Its vulnerable sites need not share the pristine-graphene threshold, and ionization, contamination and chemical etching remain possible at low voltage. Minimize dose, spread the beam while aligning and compare successive short exposures. The voltage choice suppresses one damage mechanism; it does not guarantee damage-free imaging.
Atomic-resolution contrast is primarily electron phase contrast. elastic scattering by the specimen potential changes the phase of the transmitted electron wave. interference between transmitted and diffracted components, modified by the objective lens, converts that phase change into intensity variations. Appropriate defocus, sufficiently small optical aberrations, good spatial optical coherence and transfer of the graphene spatial frequencies are needed. At exact focus an ideal weak phase object need not give a strong visible lattice.
Mass–thickness or amplitude contrast can also distinguish thicker overlap regions, folds, contamination and support film, especially when scattered electrons are excluded by an aperture. It is comparatively weak for a clean monolayer of low- carbon. diffraction contrast becomes important in crystalline, multilayer or differently oriented regions when Bragg-scattered beams are selected or excluded. Relative rotation of layers can additionally produce a moiré pattern.
A dark region alone is not a reliable layer count: electron phase contrast can change sign with defocus, and contamination also changes intensity. Use fold-edge fringes, diffraction information and calibrated image simulations or thickness-sensitive measurements together. Defect identification should likewise compare a structural model with the actual imaging conditions, rather than reading every dark lattice site as a missing atom.
Aberration-corrected scanning transmission electron microscopy with annular dark-field imaging and spatially resolved EELS can locate the Si atoms and test their chemical environment. silicon scatters much more strongly to high angles than carbon, so an isolated Si impurity can stand out in a thin graphene lattice. Neighboring carbon positions reveal whether a site is, for example, three- or four-coordinated in projection.
Acquire a spectrum image at the same time. A silicon core-loss edge identifies the element, while its energy-loss near-edge structure contains information about the unoccupied states and bonding. This combination has experimentally distinguished individual Si coordination environments in graphene.[ref]
Direct Determination of the Chemical Bonding of Individual Impurities in Graphene by Wu Zhou and others. Figures 1–2, atomic-resolution imaging and Si-edge spectra
Advantages are atom-scale spatial localization, simultaneous structural and chemical evidence, and stronger chemical identification than brightness alone. Limitations include low counts at one atom, background subtraction, finite energy resolution, drift and the high dose needed for a useful spectrum. The beam can move or damage an impurity, and a two-dimensional projection does not by itself determine its out-of-plane geometry. Compare spectra and images with plausible structural calculations rather than assigning coordination solely from one bright pixel.
The resist is positive tone, because the written regions are the regions removed during development. A suitable example is poly(methyl methacrylate), conventionally PMMA, used in its ordinary positive-tone electron-beam exposure regime. Electron-induced chain scission reduces its molar mass and increases its solubility in the developer.
The fact that this writing step fabricates an extreme ultraviolet mask does not make the resist an EUV-exposed resist: the exposure process being classified here is the electron-beam mask-writing step.
The deposited energy is a blurred, nonlocal version of the commanded write pattern. Forward scattering spreads energy within the resist; backscattered electrons from the substrate contribute a wider background; secondary electrons and the finite incident probe add further spreading. Development then removes regions whose accumulated dose exceeds the effective clearing requirement.
Line ends and isolated short rectangles receive less supporting exposure from neighboring written regions. Their ends can recede and round, and isolated features may shrink to narrow openings. Dense features receive more overlapping scattered dose. Thus one global dose cannot generally reproduce both isolated and dense shapes faithfully.
Use electron beam proximity correction: calibrate a scattering point-spread model for the actual resist, thickness, substrate and beam energy, then adjust local dwell time or beam electric current. Increase or reshape the write dose at underexposed isolated features and line ends, while compensating for the excess background in dense regions. Geometric prebias, such as modest line-end extension, can complement dose correction. A thinner resist and an appropriate higher beam energy may reduce forward-scattering blur, but the backscatter distribution must still be included. Correction must be based on the developed result, rather than assuming the incident beam diameter is the only resolution limit.
A transmissive mask is placed in contact with the resist, or a small distance above it for proximity printing. Chromium-patterned glass or quartz is a typical mask. Illumination is normally collimated ultraviolet light, with refractive illumination optics used to prepare the beam.
There is no projection objective imaging a reduced mask pattern onto the resist: the mask shadows the resist approximately one-to-one. The finite gap in proximity printing introduces diffraction and limits edge sharpness; contact printing reduces that gap at the cost of mask wear and contamination risk.
Use multilayer reflective optics and a reflective patterned mask. Near the usual extreme ultraviolet wavelength of 13.5 nm, ordinary lenses and thick transmissive masks absorb too strongly. Multilayer mirrors focus and project the image, while an absorber pattern on a multilayer-coated mask defines the exposed regions.
The optical path operates in vacuum to avoid absorption by air. The key distinction is reflective mask projection, rather than a transparent chromium-on-glass mask or a scanned electron probe.
Use electron lenses and a digitally scanned, blanked electron beam; no physical mask is required for direct writing. Electromagnetic lenses focus the charged-particle beam, deflectors place it, and the pattern generator controls position and dose. Electrostatic elements can also form part of electron optics, but these are not refractive glass lenses.
The extreme ultraviolet mask mentioned in the problem is the object being manufactured by this maskless write process, rather than a mask placed in the electron path.
Reading the straight-line extrapolation in the printed photoresist contrast curve gives approximately at unit remaining thickness and at clearing. On the logarithmic dose axis,The critical image modulation follows by requiring one exposure time to give in a bright region and in a dark region:For unit object modulation, this meansThe doses are graphical estimates, so extra significant figures would not represent greater measurement accuracy.
The printed aerial image has approximately and . Thus its modulation, and its modulation transfer for a fully modulated object, isThe image does not meet the full-thickness printing criterion, because . Equivalently, clearing the bright regions requires s, while preserving the full thickness in the dark regions requires s. There is no common exposure time.
Partial thickness modulation may remain visible, but that is different from a clean grating with fully cleared spaces and retained full-thickness lines. Small ripple peaks in the source drawing do not change this conclusion.
For a spatially coherent, on-axis source, the coherent spatial-frequency cutoff isA line-space grating must place at least its first diffracted orders within the pupil. Its limiting pitch is therefore , and its equal line/space half-pitch isThe corresponding full pitch is 143 nm. Explicitly distinguishing pitch from half-pitch avoids a factor-of-two ambiguity in the phrase “feature size.” This is an ideal optical cutoff estimate; finite resist contrast and process requirements can make the usable feature size larger.
Decreasing the source diameter increases spatial optical coherence and moves the illumination towards the coherent on-axis limit. Here the grating frequency is onlyThe zero and first orders are comfortably within the pupil for on-axis illumination. Reducing an extended source can prevent some off-axis source points from losing diffraction orders at the pupil edge, and can therefore increase the grating modulation, or leave it approximately unchanged if the relevant orders were already fully passed. It need not give a universal numerical increase: higher orders, source shape, defocus and optical aberrations matter for a binary grating.
The resist's and critical modulation in part (i) are material/process properties and do not change merely because the source becomes smaller. What may change is part (ii)'s comparison between the actual image modulation and . If the improved image exceeds about 0.667, an exposure window opens; the source information alone does not establish a new numerical value.
The important change is preorganization of the chloride-binding amide groups. In the hydroxylated host, intramolecular hydrogen bonds from the phenolic OH groups to the amide carbonyl oxygens restrict rotation and favor a geometry in which the amide NH donors converge on the anion-binding cavity. chloride can therefore accept two favorable hydrogen bonds with a smaller conformational penalty than in the unsubstituted host. The hydroxyl groups need not be counted as two additional freely available chloride donors: their role includes organizing the existing donors.
The association constant increases by . At , the corresponding difference in standard Gibbs free energy isThis is a modest molecular free-energy advantage amplified into a substantial change in the equilibrium constant. solvent competition and changes in solvation also contribute to measured binding; the structures chiefly suggest the preorganization explanation.
The molecule combines three chemically different binding regions.
- sodium: the oxygen-rich calixarene/polyether region, including the ether oxygens and suitably oriented ester carbonyl oxygens. sodium is a hard Lewis acid and favors multidentate coordination by hard oxygen donors. The scaffold holds several donors near one another and can reduce the conformational cost of binding.
- nitrate: the two urea groups. Their NH groups donate hydrogen bonds to nitrate oxygens. Several NH donors can cooperate around an anion; the carbonyl oxygen of a urea is an acceptor and is not the proposed nitrate-binding donor.
- silver: the terminal bipyridyl nitrogen donors. The pyridine lone pairs coordinate the softer silver ion. The actual coordination may involve donor sites on more than one arm or more than one receptor, depending on geometry and concentration.
These assignments identify the preferred local sites, rather than guaranteeing three independent binding constants: occupancy can alter conformation, electrostatics and the affinity of neighboring sites.
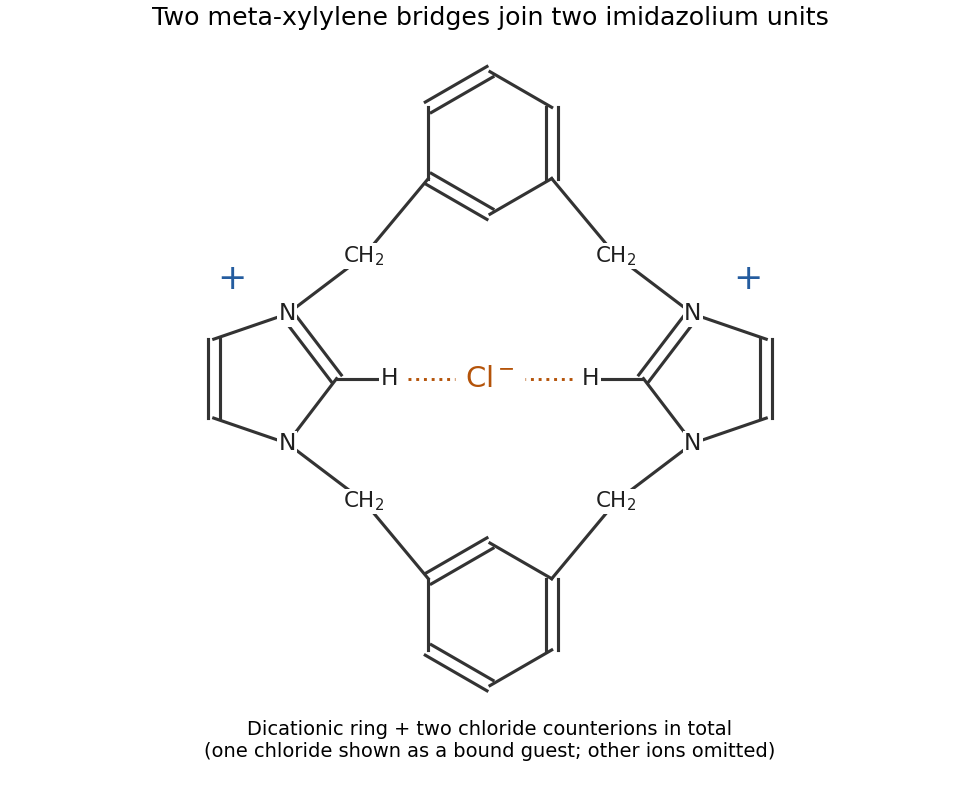
Each imidazole already has one nitrogen substituted. Its remaining pyridine-like nitrogen attacks a benzylic carbon bearing chlorine in an reaction, expelling chloride and producing an imidazolium center. Repetition at the other end closes the ring. The expected product is therefore a dicationic bis-imidazolium macrocycle, in which two meta-xylylene bridges connect the two imidazolium rings. Both nitrogens of each imidazolium are alkylated; the aryl rings remain intact.
A compact way to specify its connectivity is to traverse the ring:Here each indicated imidazolium connects its two substituents through its two different ring nitrogen atoms, rather than through a single nitrogen.
chloride acts as an anion template: association with the positively charged intermediates and the inward-facing imidazolium CH donors brings the reacting ends together, favoring cyclization over intermolecular oligomerization. Tetrabutylammonium is a spectator counterion, not a covalent part of the product. The two substitutions produce two chloride counterions for the dication; template chloride can also occupy the cavity, with the remaining ions in solution. The schematic below specifies connectivity and charge without reproducing the source drawing.
One design is an anthracene–methylene–aza-15-crown-5 sensor, with the tertiary amine of the aza-crown linked through to anthracene. The crown supplies the sodium-binding oxygen/nitrogen cavity, the amine supplies an electron donor and anthracene supplies the fluorophore. A sufficiently rigid sodium-sized cryptand could improve discrimination further.
Without a bound cation, photoinduced electron transfer from the amine can quench excited anthracene. sodium coordination lowers the electron-donating ability of that lone pair, suppressing this quenching route and increasing fluorescence. The methylene spacer allows electronic communication by electron transfer while limiting direct conjugation between the binding site and fluorophore.
A cavity appropriate to sodium is preferable to an 18-crown-6-like potassium-sized cavity. Selectivity must be tested, not inferred perfectly from cavity size. Potassium binding, including possible sandwich complexes of flexible crowns, can still compete. At the intended concentrations the design should satisfy and should give a fluorescence change on sodium binding. Rigidity, cavity size and suppression of competing stoichiometries are useful design controls. fluorescence calibration in the actual potassium-containing solvent establishes the usable detection range.
The species that oxidizes nickel is gold(III) ion, rather than metallic gold. The half-reactions areMultiplying the first by three and the second by two givesStandard electrode potentials are not multiplied by the balancing factors. Thus and six moles of electrons are transferred per mole of this balanced reaction:The negative sign predicts a thermodynamically favorable galvanic replacement under standard conditions.
Clean and degrease the nickel surface, remove its inhibiting oxide by an appropriate brief surface treatment, rinse, and immerse it in an aqueous bath containing reducible gold(III) species. Control concentration, temperature and immersion time, then rinse after the desired deposition. A solution of a gold complex is practical, but its actual reduction potential must be evaluated for that complex and bath: it need not equal the supplied free-ion standard potential.
At anodic sites nickel dissolves as , releasing electrons into the conducting substrate. Those electrons reduce gold ions at cathodic sites, nucleating and growing metallic gold. The nickel itself is the reducing agent, so no external electrical supply or separate reducing reagent is required. The coupled electron balance is three nickel atoms dissolved for two gold atoms deposited for the stated oxidation states.
The process can slow or stop when a sufficiently continuous gold coating prevents the electrolyte from reaching nickel. This is not an absolute thickness rule: pores, cracks or exposed edges preserve nickel dissolution and allow continued deposition, sometimes with undercutting. nickel passivation, depletion of gold ions near the surface, diffusion through a porous layer, bath speciation and competing reactions also affect the rate. Dense gold coverage and porous gold coverage therefore have very different limiting behavior.
Use a shaped nickel particle or nanowire as both sacrificial template and reducing agent. gold grows where nickel is consumed, allowing gold-coated particles, porous shells and, with suitable removal of the remaining nickel, hollow gold nanostructures. The original template controls the overall shape; the balance of dissolution, deposition and diffusion controls wall thickness and porosity.
A hollow product is not guaranteed simply by writing the reaction: deposition may seal a solid nickel core, whereas defects can maintain access to the interior and permit further replacement. Controlled composition and transport can give a progression from core–shell to porous or hollow structures. This is useful for high-surface-area electrodes, catalytic surfaces and plasmonic structures, while avoiding an electrical lead to every individual nanoparticle.
Three standard approaches are piezoelectric, electromagnetic and electrostatic energy harvesting.
- A piezoelectric microcantilever or nanowire develops electric polarization when strained. An inertial mass, bending substrate or vibration bends the element; electrodes and a rectifier collect charge. PZT, ZnO and PVDF illustrate different material choices. This approach needs no external bias for transduction and can give appreciable voltage in a compact element. Its capacitance gives high source impedance and relatively small electric current; brittle materials, fatigue, depolarization and a narrow mechanical resonance can limit performance.
- Electromagnetic harvesting uses relative motion of a magnet and coil to change magnetic flux, producing . A micromachined coil and movable magnet can implement it at the microscale. It can offer low source impedance and useful electric current, but the small flux and coil area make voltage and power increasingly difficult to maintain on miniaturization; coil resistance and fabrication of magnets also matter. A practical microscale device does not imply efficient scaling all the way to individual nanowires.
- Electrostatic harvesting uses a variable capacitor, for example MEMS comb fingers or moving plates. Mechanical motion changes capacitance; an initial charge, electrical bias or electret allows this change to do electrical work. Small gaps favor strong coupling and compatibility with microfabrication. Limitations include the need for charge or bias, parasitic capacitance, leakage, pull-in, stiction and dielectric breakdown.
In all three cases the output is constrained by the available mechanical input and damping. Nanoscale dimensions alone do not supply an energy advantage.
A thermocouple uses two materials with different Seebeck coefficients. With their junctions at different temperatures, the net open-circuit voltage isUsing p-type and n-type legs makes the two contributions add. Many pairs can be connected electrically in series to add voltage while remaining thermally in parallel between the same hot and cold plates. A single homogeneous wire does not provide this same complete-circuit voltage when its return lead has the same thermopower.
The reciprocal Peltier effect transports heat when electric current passes through a junction. The Kelvin relation connects the heat carried per unit charge to the Seebeck coefficient. The same combination of large thermopower, high electrical conductivity and low thermal conductivity gives a favorable dimensionless figure of meritThus materials useful for a generator are also useful for a cooler when electric current is driven in the appropriate direction. Joule heating and thermal leakage oppose cooling; device geometry, contact resistance and operating temperature must still be appropriate. Reversibility of the thermoelectric coupling does not make either device lossless.
A pyroelectric material has a spontaneous electric polarization that changes with temperature. electrodes collect the resulting change in compensating charge. For a uniform element,Consequently temperature variation in time, rather than a steady temperature difference alone, drives a pyroelectric generator. A cyclic thermal input and a suitable electrical circuit are needed for repeated energy extraction.
The primary pyroelectric effect is the change of electric polarization at fixed strain. The secondary pyroelectric effect arises because thermal expansion strains a piezoelectric crystal and thereby changes its electric polarization. In component notation its contribution iswith piezoelectric coefficients and thermal-expansion coefficients . Choosing orientation, mechanical constraint and substrate expansion so that the secondary contribution reinforces the primary one can increase the response; the signs can instead oppose one another.
An array of slender nanowires can expand more freely than a film clamped to a substrate and can exchange heat rapidly because of its high surface-to-volume ratio. Reduced clamping can recover a secondary response suppressed in the film. Faster thermal cycling can also increase electric current through . This is a geometrical opportunity rather than a universal increase of the intrinsic coefficient: screening, leakage, orientation and the actual thermal excursion must be compared. ZnO nanowire generators provide an experimental realization of pyroelectric energy conversion.[ref]
Pyroelectric nanogenerators for harvesting thermoelectric energy by Ya Yang and others. Abstract: vertically aligned ZnO nanowire arrays used for pyroelectric generation
Treat the film as a parallel-plate capacitor, initially compensated and then isolated electrically. Its capacitance and temperature-induced electric polarization charge areThe corresponding ideal open-circuit signal, with the electrode polarity defined consistently with this charge convention, isArea cancels because both charge and capacitance are proportional to it. Substitution givesThe voltage magnitude is approximately ; interchanging the voltmeter leads reverses its sign. This is an ideal capacitive result, before leakage, mobile-charge screening or loading by the measurement circuit reduces the signal.
The main characteristic peaks identify nickel and phosphorus: the spectrum has a strong Ni peak near , the Ni region near and P near . Weaker associated lines, including Ni near , can accompany them. The continuous background is bremsstrahlung from decelerated electrons.
Small carbon and oxygen signals at low energy can arise from contamination, surface oxide or preparation materials; a copper contribution can arise from the adjacent substrate within the finite interaction volume. The Cu region lies close to Ni , so overlap is particularly troublesome at low energy. A weak Cu contribution near is better separated, though still close to Ni . At the beam can excite these K lines.
Peak height is not an atomic fraction: ionization cross-sections, fluorescence yields, absorption, detector response, background and line overlap require correction. The large nickel peak therefore supports the nickel-rich assignment but does not directly give the nickel-to-phosphorus atomic ratio.
Use the supplied polynomial as an effective-atomic-number approximation for the alloys. Interpreting each quoted phosphorus number as an atomic fraction ,The gold reference yield is . Substitution gives:
| Layer | Effective atomic number | Backscatter yield | Contrast relative to gold |
|---|---|---|---|
| Au | |||
| Cu | |||
| NiP | |||
| NiP | |||
| NiP |
The ordering is gold brightest, then copper, NiP, NiP and NiP. The phosphorus-rich layer has the lowest effective atomic number.
There is a wording ambiguity in “atomic fraction of P relative to Ni.” If those numbers instead mean , first convert , giving . The three alloy contrasts then become , , , respectively. The qualitative ordering is unchanged. Both calculations explicitly use ; this simple alloy approximation is not a full electron-transport simulation.
Atomic-number contrast can explain why the gold-rich regions are bright and why the phosphorus-rich NiP layer should be somewhat darker than the other nickel–phosphorus layers. However, the calculated alloy yields differ only modestly: the NiP and NiP yields differ by about relative to NiP. Composition-only backscattering does not explain all of the strong local edge and defect contrast.
An Everhart–Thornley detector normally collects secondary electrons, not a pure backscattered-electron signal. Secondary-electron escape and collection depend strongly on local slope and edge geometry. Differential polishing, relief at interfaces, a crack or cavity, surface oxidation and local charging can therefore alter brightness without the corresponding change in bulk atomic number. backscattered electrons can also generate secondary electrons elsewhere. Crystallographic channeling and orientation can contribute additional contrast. The observed dark and bright areas should therefore be correlated with topography and composition rather than assigned a phase from intensity alone.
In high-angle annular dark-field imaging scanning transmission electron microscopy, electrons scattered to large angles give predominantly incoherent mass–thickness and atomic-number contrast. For comparable thickness, gold is much brighter than nickel–phosphorus because its atomic number is much larger. carbon in the protective cap scatters weakly, whereas its tungsten component scatters strongly. The cap is not a homogeneous low-atomic-number reference.
The gold layer follows a curved, locally distorted interface. The dark central opening in the overview is consistent with a crack, void or locally missing/thinned foil: little material along the beam path gives little high-angle scattering. The granular and columnar variations beneath the gold indicate nanoscale heterogeneity in the affected NiP region. Differences in thickness, density, porosity and composition can all contribute; diffraction/channeling effects are reduced in high-angle annular dark-field imaging but not eliminated in every geometry.
A black region is therefore evidence of low projected scattering mass, not by itself the identity of a chemical phase. In particular, a single high-angle annular dark-field imaging image does not distinguish a pre-existing void from material lost during specimen preparation.
The thin scanning transmission electron microscopy foil restricts scattering to a much smaller projected specimen volume than bulk SEM at . It reveals the nanoscale shape and continuity of the gold/NiP interface, the narrow low-density opening and the fine heterogeneous region underneath the gold, which the larger SEM interaction volume and surface-sensitive collection obscure.
The enlarged view resolves structure on the tens-of-nanometres scale: local interface roughness, small bright and dark domains and the relationship of the gold layer to the damaged or porous-looking NiP region. This helps distinguish an interface-associated defect from merely a change between nominal alloy layers. It still does not identify a crystalline phase or quantify composition without diffraction or spectroscopic analysis. Since the SEM surface and focused ion beam milling lamella need not cut precisely the same volume, correlations should allow for section position.
The conspicuous approximately vertical streaks are focused ion beam milling curtaining: different sputtering rates beneath the rough, compositionally varying cap and interfaces leave stripes of different foil thickness. The uneven lower foil edge, contrast gradient and locally thinned regions are also consistent with nonuniform milling; redeposition can add material to other regions.
A dark gap or pull-out may have been enlarged or created during milling, so its original dimensions cannot be inferred securely from this one image. ion implantation and an amorphized surface layer are additional possible focused ion beam milling effects, but they are not independently demonstrated by these intensity variations. A lower-energy final polish, improved protective cap and examination of another lamella could test the preparation contribution.
Grow the semiconductor stack epitaxially by molecular beam epitaxy or metalorganic vapor-phase epitaxy on a suitable crystalline GaAs substrate. Sequential changes of source flux or precursor supply set the GaAs/AlGaAs compositions, while dopant supply sets the n-type and p-type regions. Growth time and calibrated rate control the thicknesses of the InGaAs quantum well and the alternating reflector layers.
epitaxy preserves a common crystal orientation and clean, abrupt semiconductor interfaces. These are important both for carrier confinement in the quantum well and for low-loss optical reflection. For a DBR centered at free-space wavelength , the approximate quarter-wave condition is in each layer. Ordinary deposition of a polycrystalline coating would not provide the required active semiconductor heterostructure.
The contact dimensions are readily accessible to UV photolithography followed by directional evaporation and lift-off. A possible sequence is:
- Clean the semiconductor contact surface and coat it with a positive-tone lift-off resist stack. A bilayer giving a small undercut is useful. Soft-bake and align the mask to the intended mesa.
- Use a transparent annular opening in an otherwise opaque mask to expose the contact ring, leaving the central optical aperture covered by resist. Develop away the exposed positive resist. Contact or proximity exposure is adequate for the micrometre-scale ring; projection exposure also works.
- Evaporate the gold contact layer directionally onto the wafer. Keep the resist appreciably thicker than the metal and preserve the undercut so that metal on top of the resist does not bridge continuously to the desired ring. Evaporation is more convenient for lift-off than a strongly conformal coating.
- Dissolve the remaining resist and lift away its overlying metal. The annulus on the exposed semiconductor remains, while the central emitting aperture is free of metal.
A real device must also have appropriate ohmic contact metallurgy. gold alone on arbitrary GaAs is not automatically an ohmic contact: surface preparation, heavy contact-layer doping and, where required, a suitable alloyed contact stack are needed. The schematic gold label specifies the visible electrode, not all such process details. Order the mesa etch and contact steps so that the etchant and any anneal do not damage an already formed contact.
Use a patterned resist or hard mask and anisotropic chlorine-based reactive-ion etching, for example an appropriate inductively coupled plasma process for GaAs/AlGaAs. Ion-assisted removal gives a well-defined mesa with less lateral undercut than an isotropic wet etch. Control etch time or endpoint to obtain the specified approximately depth.
The mask must survive the etch and protect the active aperture. Control ion damage and sidewall roughness, remove residues and passivate the sidewall where required. Compatibility with the metal stack determines whether the mesa is etched before or after front-contact deposition.
With conventional electric current defined into the positive terminal, an ideal junction hasThe reverse-bias branch tends to before breakdown. In forward bias the electric current rises exponentially; a visibly sharp “turn-on” is a convenient operating description rather than a discontinuity in the equation. A powered LED emits in quadrant I, where , and the device absorbs electrical power . Strong reverse breakdown lies outside the ideal curve below.
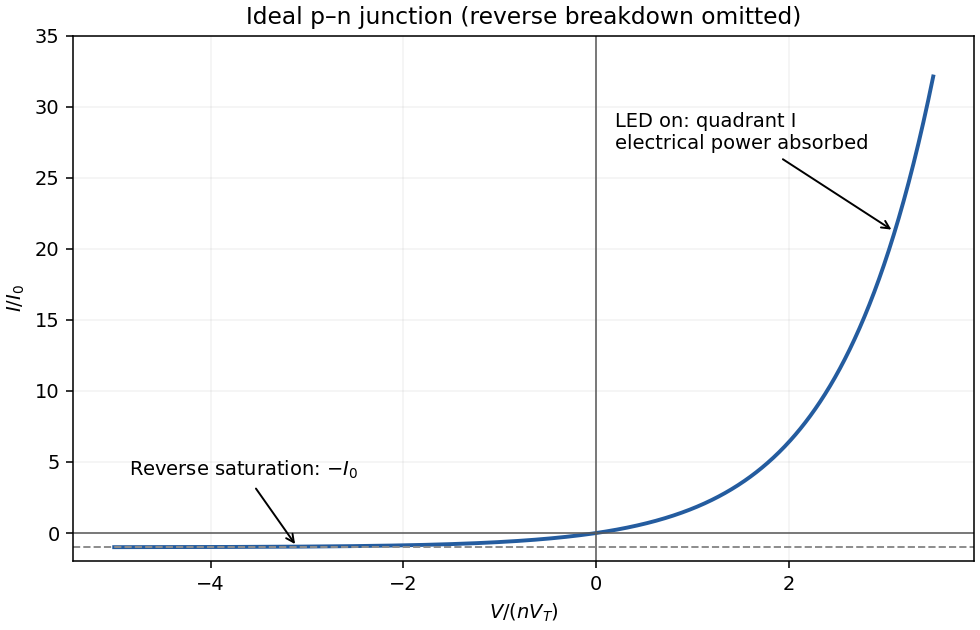


forward bias opposes the built-in electric field and lowers the junction barrier from approximately to . In the abrupt-junction depletion approximation,Thus the depletion region narrows and carriers cross the reduced barrier more readily. electron injection into the p side and hole injection into the n side increase strongly, allowing radiative recombination in an LED.
The injected minority-carrier concentrations, and therefore the ideal diffusion electric current, vary approximately as . This produces the steep forward branch of the electric current–voltage curve. One should not extrapolate the depletion-width formula to claim that the junction must lose its entire depletion region before conducting; appreciable electric current flows while a barrier remains, and high injection and series resistance eventually invalidate the simple formulas.
Taking room temperature as , the thermal voltage is . For the stated ideal diode, , soThe term is negligible here. A different precise interpretation of room temperature changes the result noticeably because of the exponential; the calculation above states its temperature explicitly.
For a lower-bandgap material, the intrinsic carrier concentration generally rises, increasing the reverse saturation current density, approximately through with when other parameters are held comparable. Thus the forward electric current at the same voltage would normally increase. If were artificially held fixed at the supplied numerical value, however, the ideal-diode equation would give the same electric current: the band gap dependence enters through the material parameters rather than as a separate term in that equation.
Interpret the supplied free energies as standard reaction free energies and use . The dimensionless equilibrium constants areUnder the ideal-solution approximation, and . Set , with units . Conservation counts two original molecules in each dimer:The physical, positive root can be written without subtractive cancellation asThe resulting concentrations are:
| Initial analytical concentration | /M | /M | /M |
|---|---|---|---|
For example, the first row satisfies ; using would incorrectly count dimers. At both concentrations almost all molecular units belong to dimers.
dimer formation is favored by sufficiently high concentration because it joins two molecules. Dilution favors the separated species, whereas is concentration-independent in this ideal model. More than half the molecular units are dimerized when , equivalently . The supplied free energies at one temperature do not determine a temperature trend without additional enthalpy information. At , neglected nonideal activities could be significant; the table is the requested concentration-based model.
The end groups associate reversibly through a complementary hydrogen-bond array. At low concentration, bringing the two ends of the same molecule together avoids the concentration-dependent cost of finding another molecule, so an intramolecular ring is favored.
For A, increasing concentration permits end-to-end intermolecular association to compete successfully with ring closure. It produces long, reversible supramolecular chains. Increasing chain length and entanglement account for the highly viscous solution without requiring covalent polymerization.
B has more favorably positioned attachment points on its rigid aromatic core. Its arms can close a less strained ring, so intramolecular association remains strongly competitive over the stated range. Predominantly discrete rings do not form the same extended chain network, explaining the retained fluidity. Both compounds can make the same local hydrogen bonds; their different balance of ring strain, preorganization and intermolecular association explains the macroscopic difference.
Articles were limited to the first 100 out of 249 total.
Articles by others on the same topic
There are currently no matching articles.