Put . A cobweb plot alternates a vertical move to the function graph with a horizontal move to the diagonal . Beginning at , the first iterates areThe diagram shows the ensuing approach to with alternating deviations. More precisely, if , Taylor expansion at the fixed point givesFor sufficiently small nonzero deviations the sign reverses each step and their magnitudes contract. The local approach is an alternating, geometrically damped oscillation, with asymptotic contraction factor per iterate.
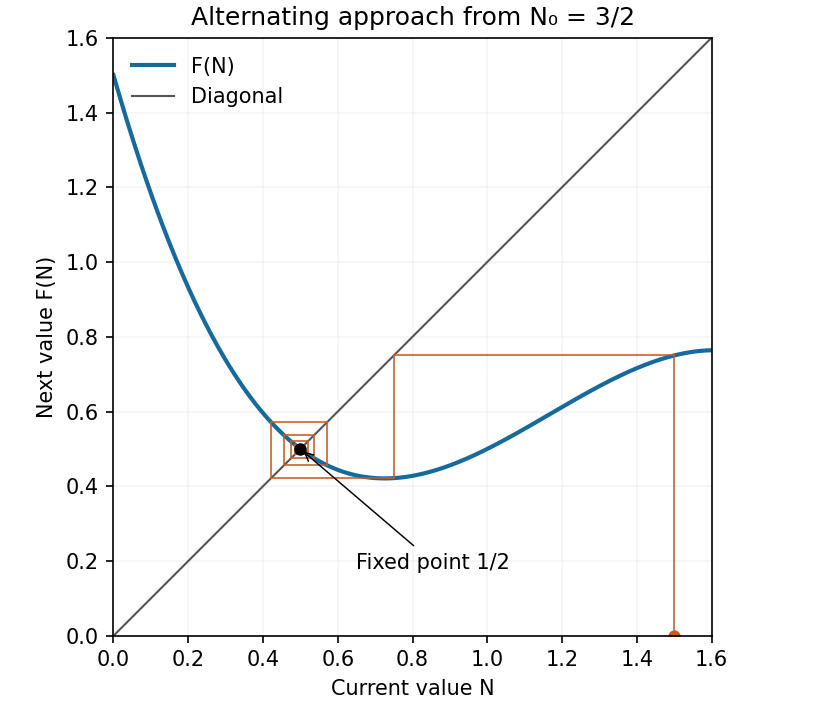
Cobweb approaching the attracting fixed point
. Details. 
First establish a uniform upper bound. Direct subtraction givesbecause the quadratic polynomial has positive leading coefficient and discriminant . The assumed positivity of therefore places in .
This interval is forward invariant. On and on , the three factors in have nonnegative product, hence . On the product is nonpositive, butso . Together with the upper bound this proves . Induction now givesThe hypothesis on the first image is essential for initial values outside that invariant interval.
Articles by others on the same topic
There are currently no matching articles.