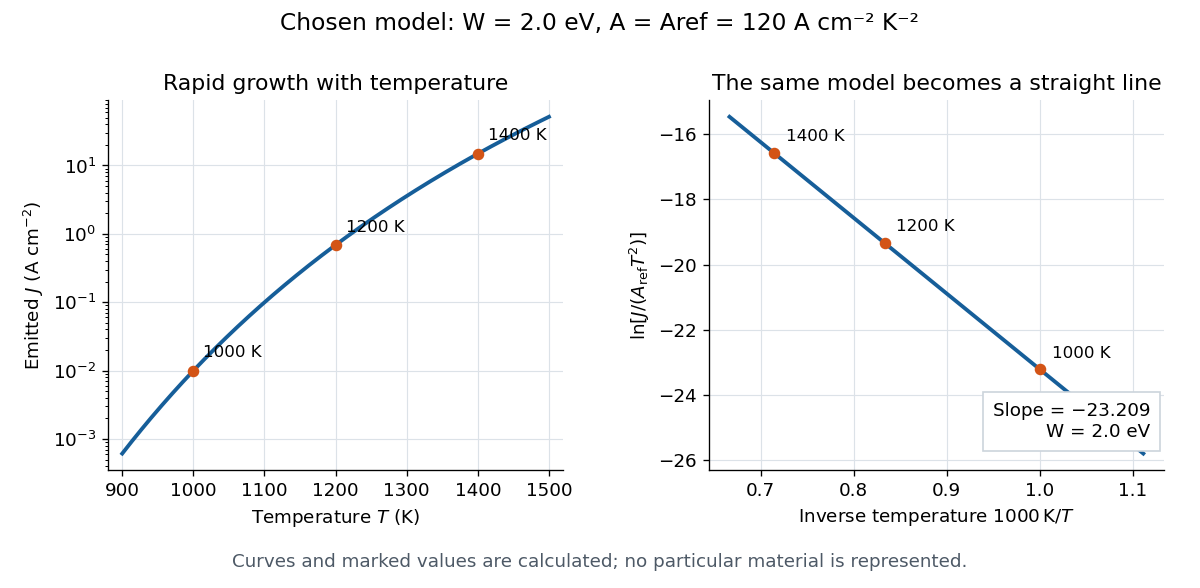
Choose a fixed positive reference with the same units as . Taking the natural logarithm of a dimensionless ratio givesThus the Richardson plot is a straight line when and are constant, with slope and intercept . The familiar notation silently chooses units; the reference makes that choice explicit. Changing shifts the intercept and leaves the inferred work function unchanged. If the horizontal axis instead uses , its slope is .
For the chosen example, choose . Then and . Their slope is approximately , giving . Two temperatures determine a line algebraically; several temperatures allow curvature and drift to be detected. These values are calculated, rather than experimental observations.

A straight trace alone does not establish a unique surface work function. Adsorption, changing surface coverage, or a mixture of regions with different barriers can change the inferred slope. For independent emitting patches with area fractions , constant and barriers ,Lower barriers contribute disproportionately. Even with fixed patches, the slope of the Richardson plot gives a temperature-dependent weighted mean of the , rather than their simple area average. If or themselves vary with temperature, the apparent slope-derived barrier becomesCheck collection, temperature calibration, and surface stability before assigning curvature to a new emission mechanism.
Articles by others on the same topic
There are currently no matching articles.