The 19th century in New Zealand was a period marked by the emergence of the country's scientific community, including contributions from physicists, though the field was still developing. Key developments in physics during this time were often influenced by broader scientific and technological advancements happening around the world. One notable figure was Sir George Everest, who, while primarily a land surveyor and geographer, made contributions related to geodesy and the accurate measurement of land in New Zealand.
Alexandre Lazarian is a prominent astrophysicist known for his work in the field of astrophysical sciences, particularly related to interstellar medium, cosmic dust, and the dynamics of astrophysical processes. He has contributed to various areas including studies of magnetic fields in space, star formation, and the behavior of plasma in cosmic environments. His research often incorporates advanced simulations and theoretical models to explore and explain complex astrophysical phenomena.
The 21st century has seen several notable Finnish physicists making contributions across various fields, including condensed matter physics, quantum physics, and materials science. While it's difficult to provide an exhaustive list, here are a few prominent Finnish physicists who have made significant impacts in their respective areas: 1. **Jukka Koskinen**: Known for his work in theoretical physics, particularly in the field of quantum materials and many-body physics.
The term "Tamil physicists" refers to physicists who are of Tamil origin or who have made significant contributions to the field of physics while being associated with the Tamil-speaking community, primarily from the Indian state of Tamil Nadu or the northern part of Sri Lanka. Several notable physicists of Tamil heritage have made significant contributions to various fields of physics, including theoretical physics, condensed matter physics, and astrophysics. Some renowned physicists of Tamil origin include: 1. **C.V.
Neil Lambert could refer to a few different individuals, as it is a relatively common name. One notable figure is Neil Lambert, a British author known for his contributions to literature, particularly in the realms of science fiction and fantasy. His works can often feature intricate world-building and engaging storytelling.
Victor V. Moshchalkov is a prominent physicist known for his work in the fields of condensed matter physics, particularly in superconductivity and nanostructures. He is affiliated with research institutions and universities, where he has contributed to advancing the understanding of superconducting materials, vortex physics, and low-dimensional systems.
Gabonese physicists are individuals who practice or specialize in physics and are from Gabon or are of Gabonese nationality. Physics is a branch of science that deals with the properties and interactions of matter and energy, and physicists conduct research, experiments, and theoretical studies to understand the laws governing the physical universe. In Gabon, physicists may work in various fields such as academia, research institutions, government agencies, or private industry.
"Nepalese physicists" refers to physicists who are from Nepal or are of Nepalese nationality. These individuals engage in the study and application of physics, contributing to various fields such as theoretical physics, experimental physics, astrophysics, condensed matter physics, and more. Nepal has a growing academic and research community in the field of physics, with institutions like Tribhuvan University and the Nepal Academy of Science and Technology contributing to the education and training of physicists.
"Singaporean physicists" refers to physicists who are from Singapore, who study or work in the field of physics, or who have a connection to Singapore through their research or academic activities. Singapore has a growing scientific community and is home to several institutions and universities, such as the National University of Singapore (NUS) and the Nanyang Technological University (NTU), where many physicists conduct research.
Accelerator physicists are scientists who specialize in the design, construction, and operation of particle accelerators—machines that use electromagnetic fields to propel charged particles, such as electrons and protons, to high speeds and to contain them in well-defined beams. These accelerators are crucial tools in various fields of research, including particle physics, nuclear physics, materials science, and medical applications.
John Dirk Walecka is a prominent American theoretical physicist known for his significant contributions to nuclear and particle physics. He is particularly well known for his work on the theoretical aspects of nuclear many-body systems, including the development of the relativistic mean field theory, which provides a framework for understanding the structure and dynamics of atomic nuclei. Walecka's research has implications for various areas, including nuclear astrophysics and the understanding of neutron stars.
Astronomy is a field studied at many academic institutions around the world, with various universities and research centers having strong programs in astronomy and astrophysics. Here are some notable institutions known for their contributions to astronomy: 1. **Harvard University** - Home to the Harvard-Smithsonian Center for Astrophysics, it is one of the leading institutions for advanced research in astronomy.
Pinned article: Introduction to the OurBigBook Project
Welcome to the OurBigBook Project! Our goal is to create the perfect publishing platform for STEM subjects, and get university-level students to write the best free STEM tutorials ever.
Everyone is welcome to create an account and play with the site: ourbigbook.com/go/register. We belive that students themselves can write amazing tutorials, but teachers are welcome too. You can write about anything you want, it doesn't have to be STEM or even educational. Silly test content is very welcome and you won't be penalized in any way. Just keep it legal!
Intro to OurBigBook
. Source. We have two killer features:
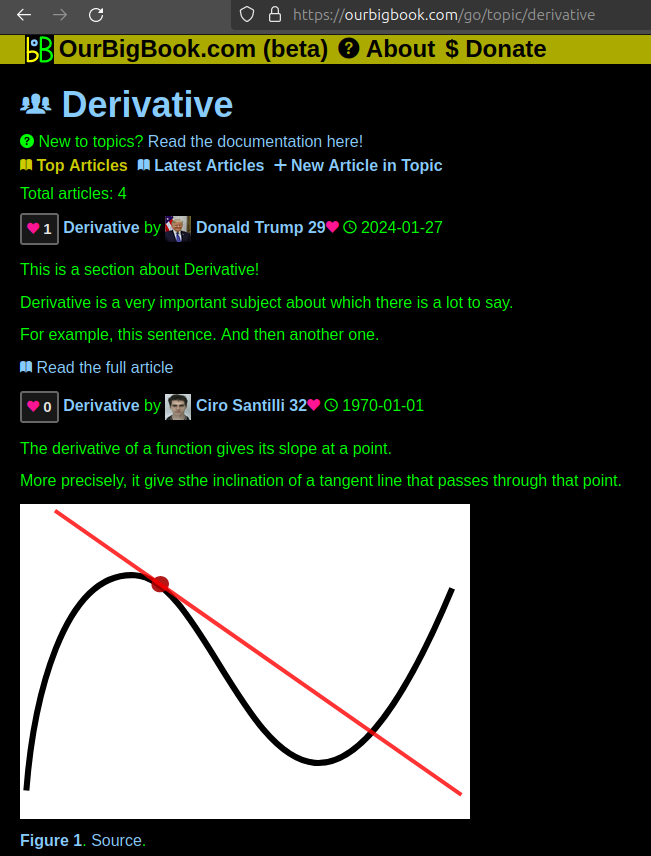
- topics: topics group articles by different users with the same title, e.g. here is the topic for the "Fundamental Theorem of Calculus" ourbigbook.com/go/topic/fundamental-theorem-of-calculusArticles of different users are sorted by upvote within each article page. This feature is a bit like:
- a Wikipedia where each user can have their own version of each article
- a Q&A website like Stack Overflow, where multiple people can give their views on a given topic, and the best ones are sorted by upvote. Except you don't need to wait for someone to ask first, and any topic goes, no matter how narrow or broad
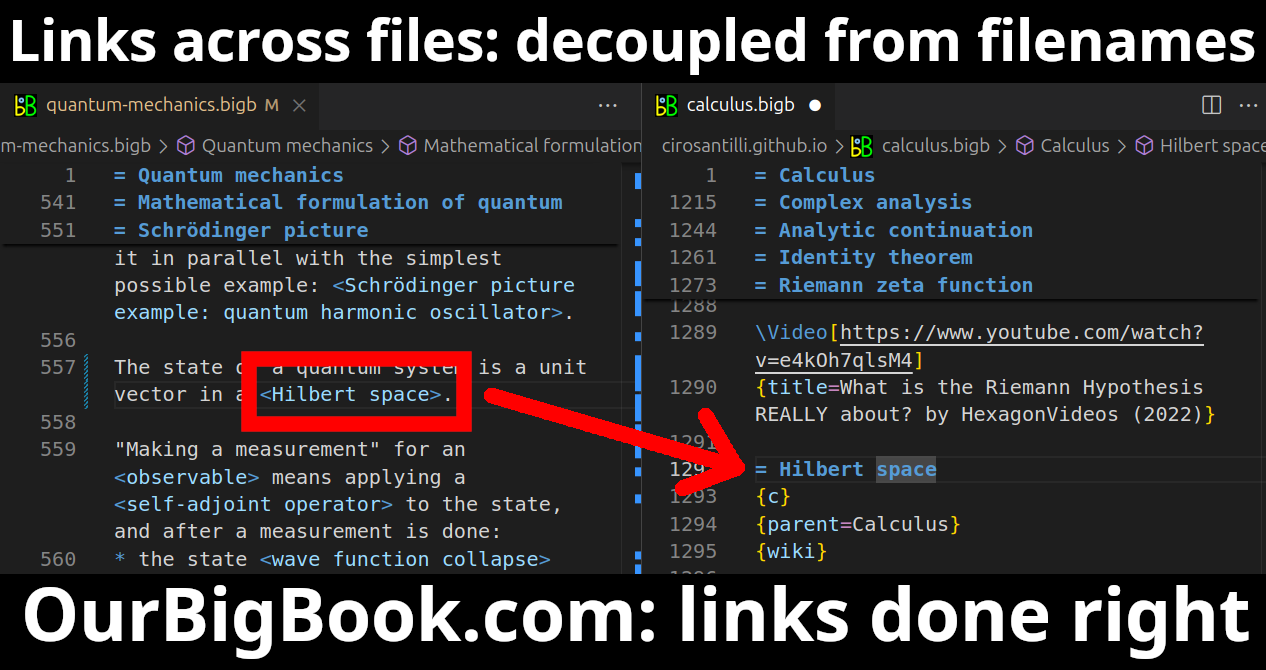
This feature makes it possible for readers to find better explanations of any topic created by other writers. And it allows writers to create an explanation in a place that readers might actually find it.Figure 1. Screenshot of the "Derivative" topic page. View it live at: ourbigbook.com/go/topic/derivativeVideo 2. OurBigBook Web topics demo. Source. - local editing: you can store all your personal knowledge base content locally in a plaintext markup format that can be edited locally and published either:This way you can be sure that even if OurBigBook.com were to go down one day (which we have no plans to do as it is quite cheap to host!), your content will still be perfectly readable as a static site.
- to OurBigBook.com to get awesome multi-user features like topics and likes
- as HTML files to a static website, which you can host yourself for free on many external providers like GitHub Pages, and remain in full control
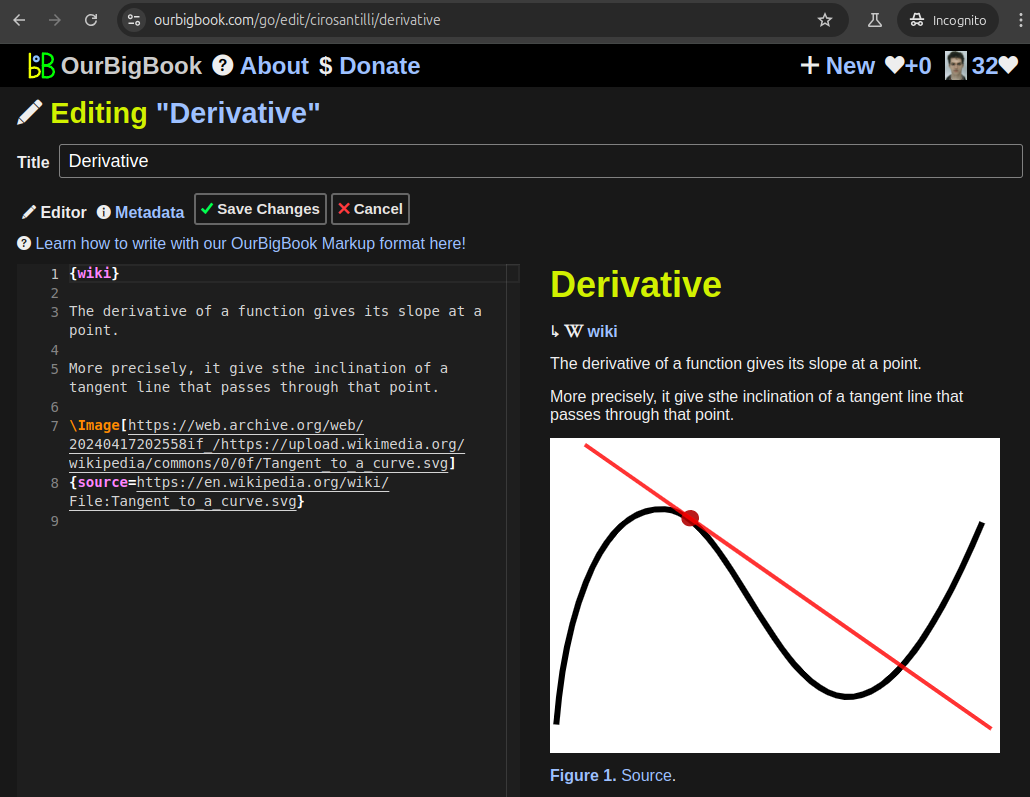
Figure 3. Visual Studio Code extension installation.Figure 4. Visual Studio Code extension tree navigation.Figure 5. Web editor. You can also edit articles on the Web editor without installing anything locally.Video 3. Edit locally and publish demo. Source. This shows editing OurBigBook Markup and publishing it using the Visual Studio Code extension.Video 4. OurBigBook Visual Studio Code extension editing and navigation demo. Source. - Infinitely deep tables of contents:
All our software is open source and hosted at: github.com/ourbigbook/ourbigbook
Further documentation can be found at: docs.ourbigbook.com
Feel free to reach our to us for any help or suggestions: docs.ourbigbook.com/#contact


