Astrophysical X-ray sources are celestial objects that emit X-rays, a form of high-energy electromagnetic radiation. These sources are found throughout the universe and can vary widely in nature and origin. Some of the main types of astrophysical X-ray sources include: 1. **X-ray Binaries**: These systems consist of a normal star and a compact object such as a black hole or a neutron star. The compact object pulls material from the normal star, forming an accretion disk.
Astrophysics research institutes are scientific organizations or institutions dedicated to the study of astrophysics, which is the branch of astronomy that deals with the physical properties and underlying processes of celestial bodies and the universe as a whole. These institutes typically conduct research, provide educational programs, and promote public outreach and engagement related to the field of astrophysics.
The Atkinson-Mingarelli theorem is a result in the field of differential equations, particularly in the context of boundary value problems for second-order ordinary differential equations (ODEs). It deals with the existence of multiple solutions to certain types of boundary value problems. The theorem essentially states conditions under which a second-order linear differential equation can have multiple solutions based on its boundary conditions and the nature of the functions involved.
Finite Element Exterior Calculus (FEEC) is a mathematical framework that unifies the finite element method (FEM) with the theory of differential forms and exterior calculus. It provides a systematic way to analyze and construct finite element methods for a variety of problems in applied mathematics, physics, and engineering, particularly those described by differential equations of a geometrical or physical nature. ### Key Concepts 1.
A leaky integrator is a mathematical model often used in various fields such as neuroscience, control systems, and signal processing to describe a system that accumulates (integrates) an input signal over time but loses some of that accumulated value gradually (leaks out) due to a decay or damping factor. ### Key Characteristics: 1. **Integration**: The leaky integrator takes an input signal and integrates it over time.
The Liénard–Chipart criterion is a method used to analyze the stability of equilibrium points in dynamical systems, particularly for nonlinear systems described by second-order differential equations. It is especially applicable to systems that can be expressed in the form of a Liénard equation, which is a specific type of differential equation often seen in mechanical and electrical oscillators.
The Method of Lines (MOL) is a numerical technique used to solve partial differential equations (PDEs) by converting them into a set of ordinary differential equations (ODEs). This method is particularly useful for problems that involve time-dependent processes or spatial variables. ### Steps in the Method of Lines: 1. **Spatial Discretization**: - The first step involves discretizing the spatial domain. This is done by dividing the spatial variables into a grid or mesh.
Moving Least Squares (MLS) is a mathematical technique often used in the fields of computer graphics, geometric modeling, and numerical analysis. The method is particularly useful for tasks such as surface fitting, shape reconstruction, and data interpolation. ### Key Concepts of Moving Least Squares: 1. **Local Fitting**: MLS operates on the principle of fitting a local polynomial to a subset of data points around a location of interest.
In numerical methods, particularly when dealing with finite difference methods or grid-based simulations, the term "stencil" refers to a template used to specify how a point in a discrete domain is influenced by its neighboring points. The stencil indicates which neighboring points are taken into account when calculating the value at a specific grid point. A **non-compact stencil** is a type of stencil that includes a relatively large number of neighboring points, often extending several grid points away from the center point of interest.
Q-analysis, also known as Q-methodology, is a research method used in fields such as psychology, sociology, and political science to study people's subjective experiences, opinions, and beliefs about specific topics. Developed by psychologist William Stephenson in the 1930s, it combines qualitative and quantitative techniques to analyze how individuals sort and rank various items based on their preferences or perspectives.
The term "Shekel function" may refer to a specific mathematical function used in optimization problems, particularly within the field of benchmark functions for testing optimization algorithms. The Shekel function is often utilized to evaluate the performance of such algorithms due to its well-defined characteristics, including having multiple local minima.
India's atomic and nuclear energy research is primarily focused on the development and application of nuclear technology for peaceful purposes, including electricity generation, medical applications, and scientific research. This research is carried out by several institutions, with the Department of Atomic Energy (DAE) being the key government body responsible for overseeing nuclear energy activities in the country. Here are some key aspects of nuclear energy research in India: ### 1.
Symlet is a family of wavelets used in signal processing and data analysis. They are a type of wavelet that was developed as a modification of the Daubechies wavelets, which are known for their compact support and orthogonality properties. Symlets are specifically designed to be symmetrical (or nearly symmetrical) and have better symmetry properties than the original Daubechies wavelets, making them particularly useful for certain applications, especially in image processing and denoising.
Buffon's needle is a probabilistic problem that involves dropping a needle of a certain length onto a plane with parallel lines drawn at regular intervals. The problem was first posed by the French mathematician Georges-Louis Leclerc, Comte de Buffon, in the 18th century. Here's the set-up of the problem: 1. **Needle and Lines**: Imagine a plane with equally spaced parallel lines that are a distance \( d \) apart.
Fuzzy-trace theory is a psychological framework developed to explain how people process information and make decisions. It was introduced primarily by psychologists Henry L. Roediger III and Patricia A. G. H. Brainerd in the 1990s. The theory posits that individuals create mental representations of experiences in two distinct ways: in a precise manner (verbatim) and in a more generalized or fuzzy manner (gist).
The **survival function**, often denoted as \( S(t) \), is a fundamental concept in survival analysis and statistics, particularly in the context of time-to-event data. It describes the probability that a subject or an individual survives beyond a certain time \( t \).
Econometrics is a branch of economics that applies statistical and mathematical methods to analyze economic data and test economic theories. It aims to give empirical content to economic relationships, allowing economists to quantify and understand the complexities of economic phenomena. The primary tasks of econometrics include: 1. **Model Specification**: Developing economic models that represent relationships between different economic variables, such as consumption and income, or price and demand.
Social statistics is a branch of statistics that focuses on the collection, analysis, interpretation, and presentation of quantitative data related to social phenomena. It involves the use of statistical methods to understand and describe social patterns, relationships, and trends within populations. Social statistics is commonly applied in various fields, including sociology, psychology, economics, education, and public health, among others.
Marketing science refers to the quantitative and analytical approach used to understand and optimize marketing strategies and practices. It combines methodologies from areas such as statistics, data analysis, economics, and behavioral science to inform marketing decision-making and improve overall effectiveness. Here's a breakdown of its key components: 1. **Data Analysis**: Marketing scientists utilize large datasets from various sources, such as consumer behavior, sales data, and market research, to glean insights about market trends, customer preferences, and campaign effectiveness.
Pinned article: Introduction to the OurBigBook Project
Welcome to the OurBigBook Project! Our goal is to create the perfect publishing platform for STEM subjects, and get university-level students to write the best free STEM tutorials ever.
Everyone is welcome to create an account and play with the site: ourbigbook.com/go/register. We belive that students themselves can write amazing tutorials, but teachers are welcome too. You can write about anything you want, it doesn't have to be STEM or even educational. Silly test content is very welcome and you won't be penalized in any way. Just keep it legal!
Intro to OurBigBook
. Source. We have two killer features:
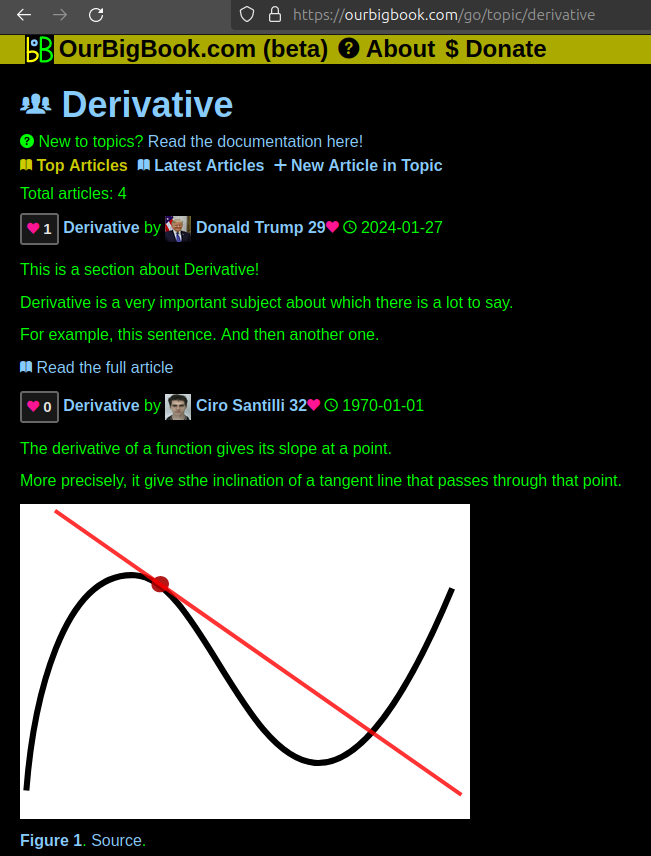
- topics: topics group articles by different users with the same title, e.g. here is the topic for the "Fundamental Theorem of Calculus" ourbigbook.com/go/topic/fundamental-theorem-of-calculusArticles of different users are sorted by upvote within each article page. This feature is a bit like:
- a Wikipedia where each user can have their own version of each article
- a Q&A website like Stack Overflow, where multiple people can give their views on a given topic, and the best ones are sorted by upvote. Except you don't need to wait for someone to ask first, and any topic goes, no matter how narrow or broad
This feature makes it possible for readers to find better explanations of any topic created by other writers. And it allows writers to create an explanation in a place that readers might actually find it.Figure 1. Screenshot of the "Derivative" topic page. View it live at: ourbigbook.com/go/topic/derivativeVideo 2. OurBigBook Web topics demo. Source. - local editing: you can store all your personal knowledge base content locally in a plaintext markup format that can be edited locally and published either:This way you can be sure that even if OurBigBook.com were to go down one day (which we have no plans to do as it is quite cheap to host!), your content will still be perfectly readable as a static site.
- to OurBigBook.com to get awesome multi-user features like topics and likes
- as HTML files to a static website, which you can host yourself for free on many external providers like GitHub Pages, and remain in full control
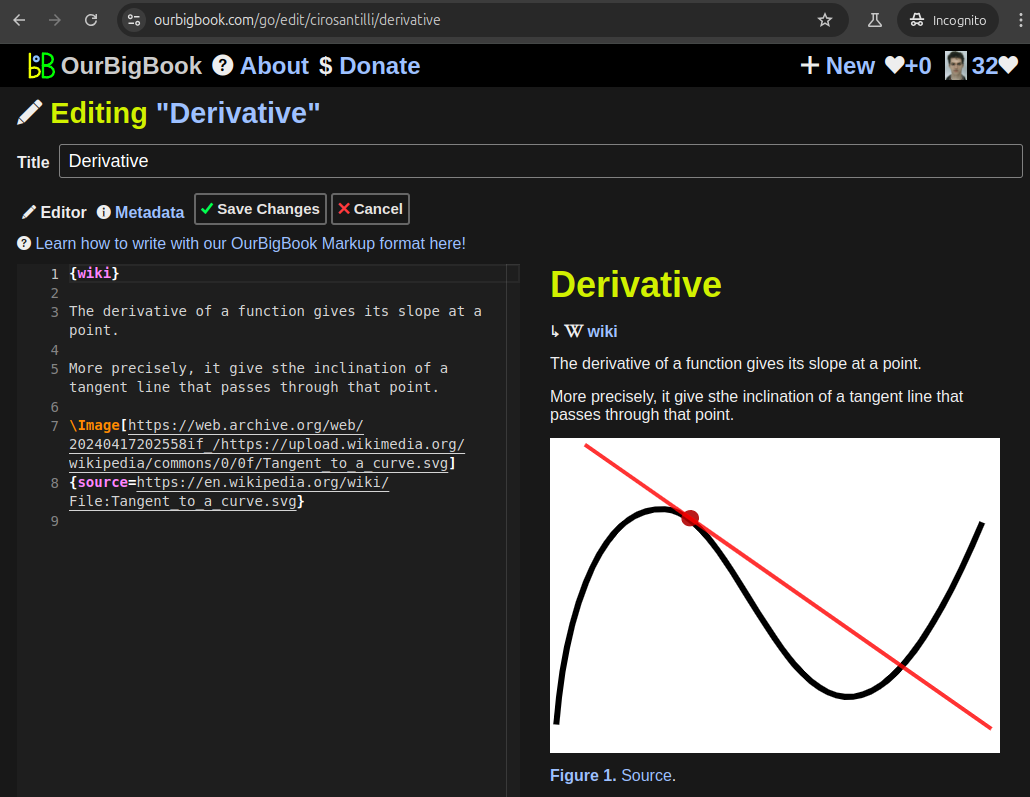
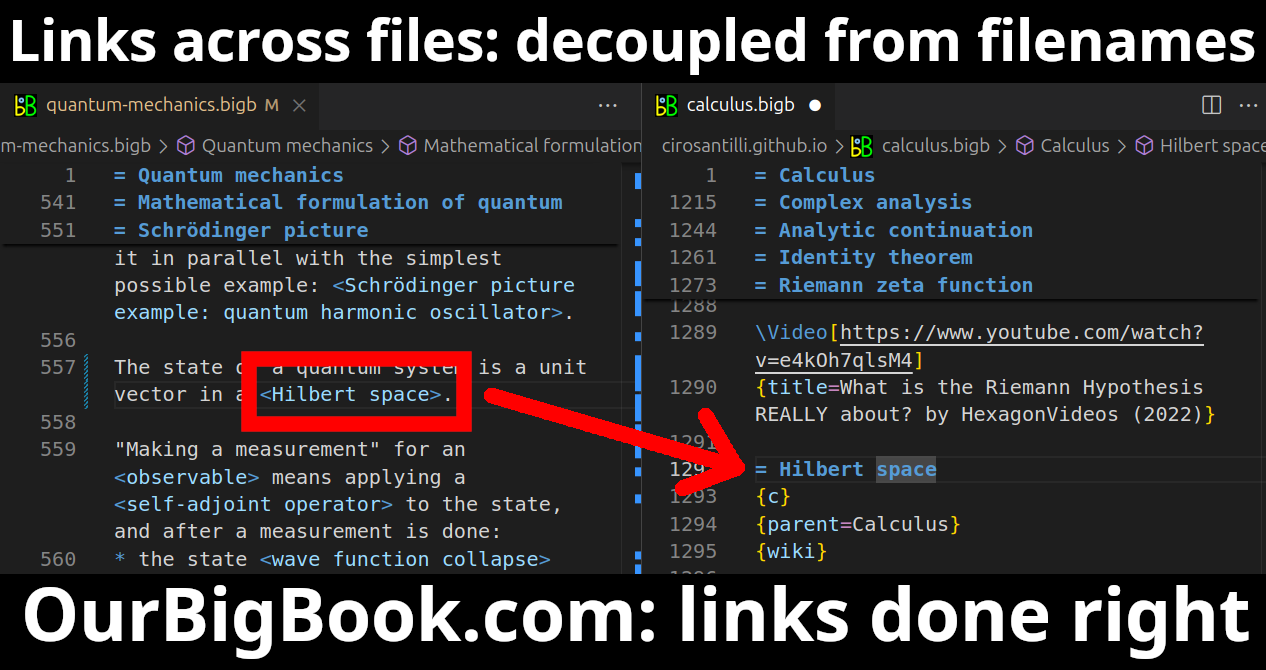
Figure 3. Visual Studio Code extension installation.Figure 4. Visual Studio Code extension tree navigation.Figure 5. Web editor. You can also edit articles on the Web editor without installing anything locally.Video 3. Edit locally and publish demo. Source. This shows editing OurBigBook Markup and publishing it using the Visual Studio Code extension.Video 4. OurBigBook Visual Studio Code extension editing and navigation demo. Source. - Infinitely deep tables of contents:
All our software is open source and hosted at: github.com/ourbigbook/ourbigbook
Further documentation can be found at: docs.ourbigbook.com
Feel free to reach our to us for any help or suggestions: docs.ourbigbook.com/#contact


