
Ciro Santilli approves of this one, related: Section "Free gifted education".
The downside of the Thiel Fellowship is that it is realistically impossible for its fellows to do anything in deep tech, only information science startups would be possible, as they would not have the labs, or lab skills required for any deep tech if they drop out before a PhD. Related: Section "The only reason for universities to exist should be the laboratories".
The only solution is the harder process of actually remodelling our very broken educational system.
Sponsored by National Academy of Sciences, located in Long Island.
Some photos at: www.nasonline.org/about-nas/history/archives/milestones-in-NAS-history/shelter-island-conference-photos.html on the website of National Academy of Sciences, therefore canon.
This is where Isidor Rabi exposed experiments carried out on the anomalous magnetic dipole moment and Willis Lamb presented his work on the Lamb shift.
It was a very private and intimate conference, that gathered the best physicists of the area, one is reminded of the style of the Solvay Conference.
QED and the men who made it: Dyson, Feynman, Schwinger, and Tomonaga by Silvan Schweber (1994) chapter 4.1 this conference was soon compared to the First Solvay Conference (1911), which set in motion the development of non-relativistic quantum mechanics.
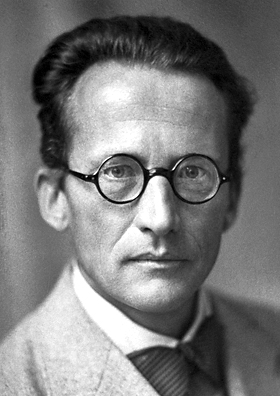
A charismatic, perfect-English-accent (Received Pronunciation) physicist from University of Cambridge, specializing in quantum field theory.
He has done several "vulgarization" lectures, some of which could be better called undergrad appetizers rather, a notable example being Video "Quantum Fields: The Real Building Blocks of the Universe by David Tong (2017)" for the prestigious Royal Institution, but remains a hardcore researcher: scholar.google.com/citations?hl=en&user=felFiY4AAAAJ&view_op=list_works&sortby=pubdate. Lots of open access publications BTW, so kudos.
The amount of lecture notes on his website looks really impressive: www.damtp.cam.ac.uk/user/tong/teaching.html, he looks like a good educator.
David has also shown some interest in applications of high energy mathematical ideas to condensed matter, e.g. links between the renormalization group and phase transition phenomena. TODO there was a YouTube video about that, find it and link here.
Ciro Santilli wonders if his family is of East Asian, origin and if he can still speak any east asian languages. "Tong" is of course a transcription of several major Chinese surnames and from looks he could be mixed blood, but as mentioned at www.ancestry.co.uk/name-origin?surname=tong it can also be an English "metonymic occupational name for a maker or user of tongs". After staring at his picture for a while Ciro is going with the maker of tongs theory initially.
The Story of John Bardeen at the University of Illinois (2010)
Source. - youtu.be/OyV8qSwGUHU?t=976 of when Bardeen demoed the transistor in class is particularly memorable
- youtu.be/OyV8qSwGUHU?t=1105 some of his golf colleagues didn't know he had won a Nobel Prize!
The bald confident chilled out particle physics guy from Stanford University!
Also one can't stop thinking abot Leonard Hofstadter from The Big Bang Theory upoen hearing his name.

Leonard Susskind lecturing in 2013
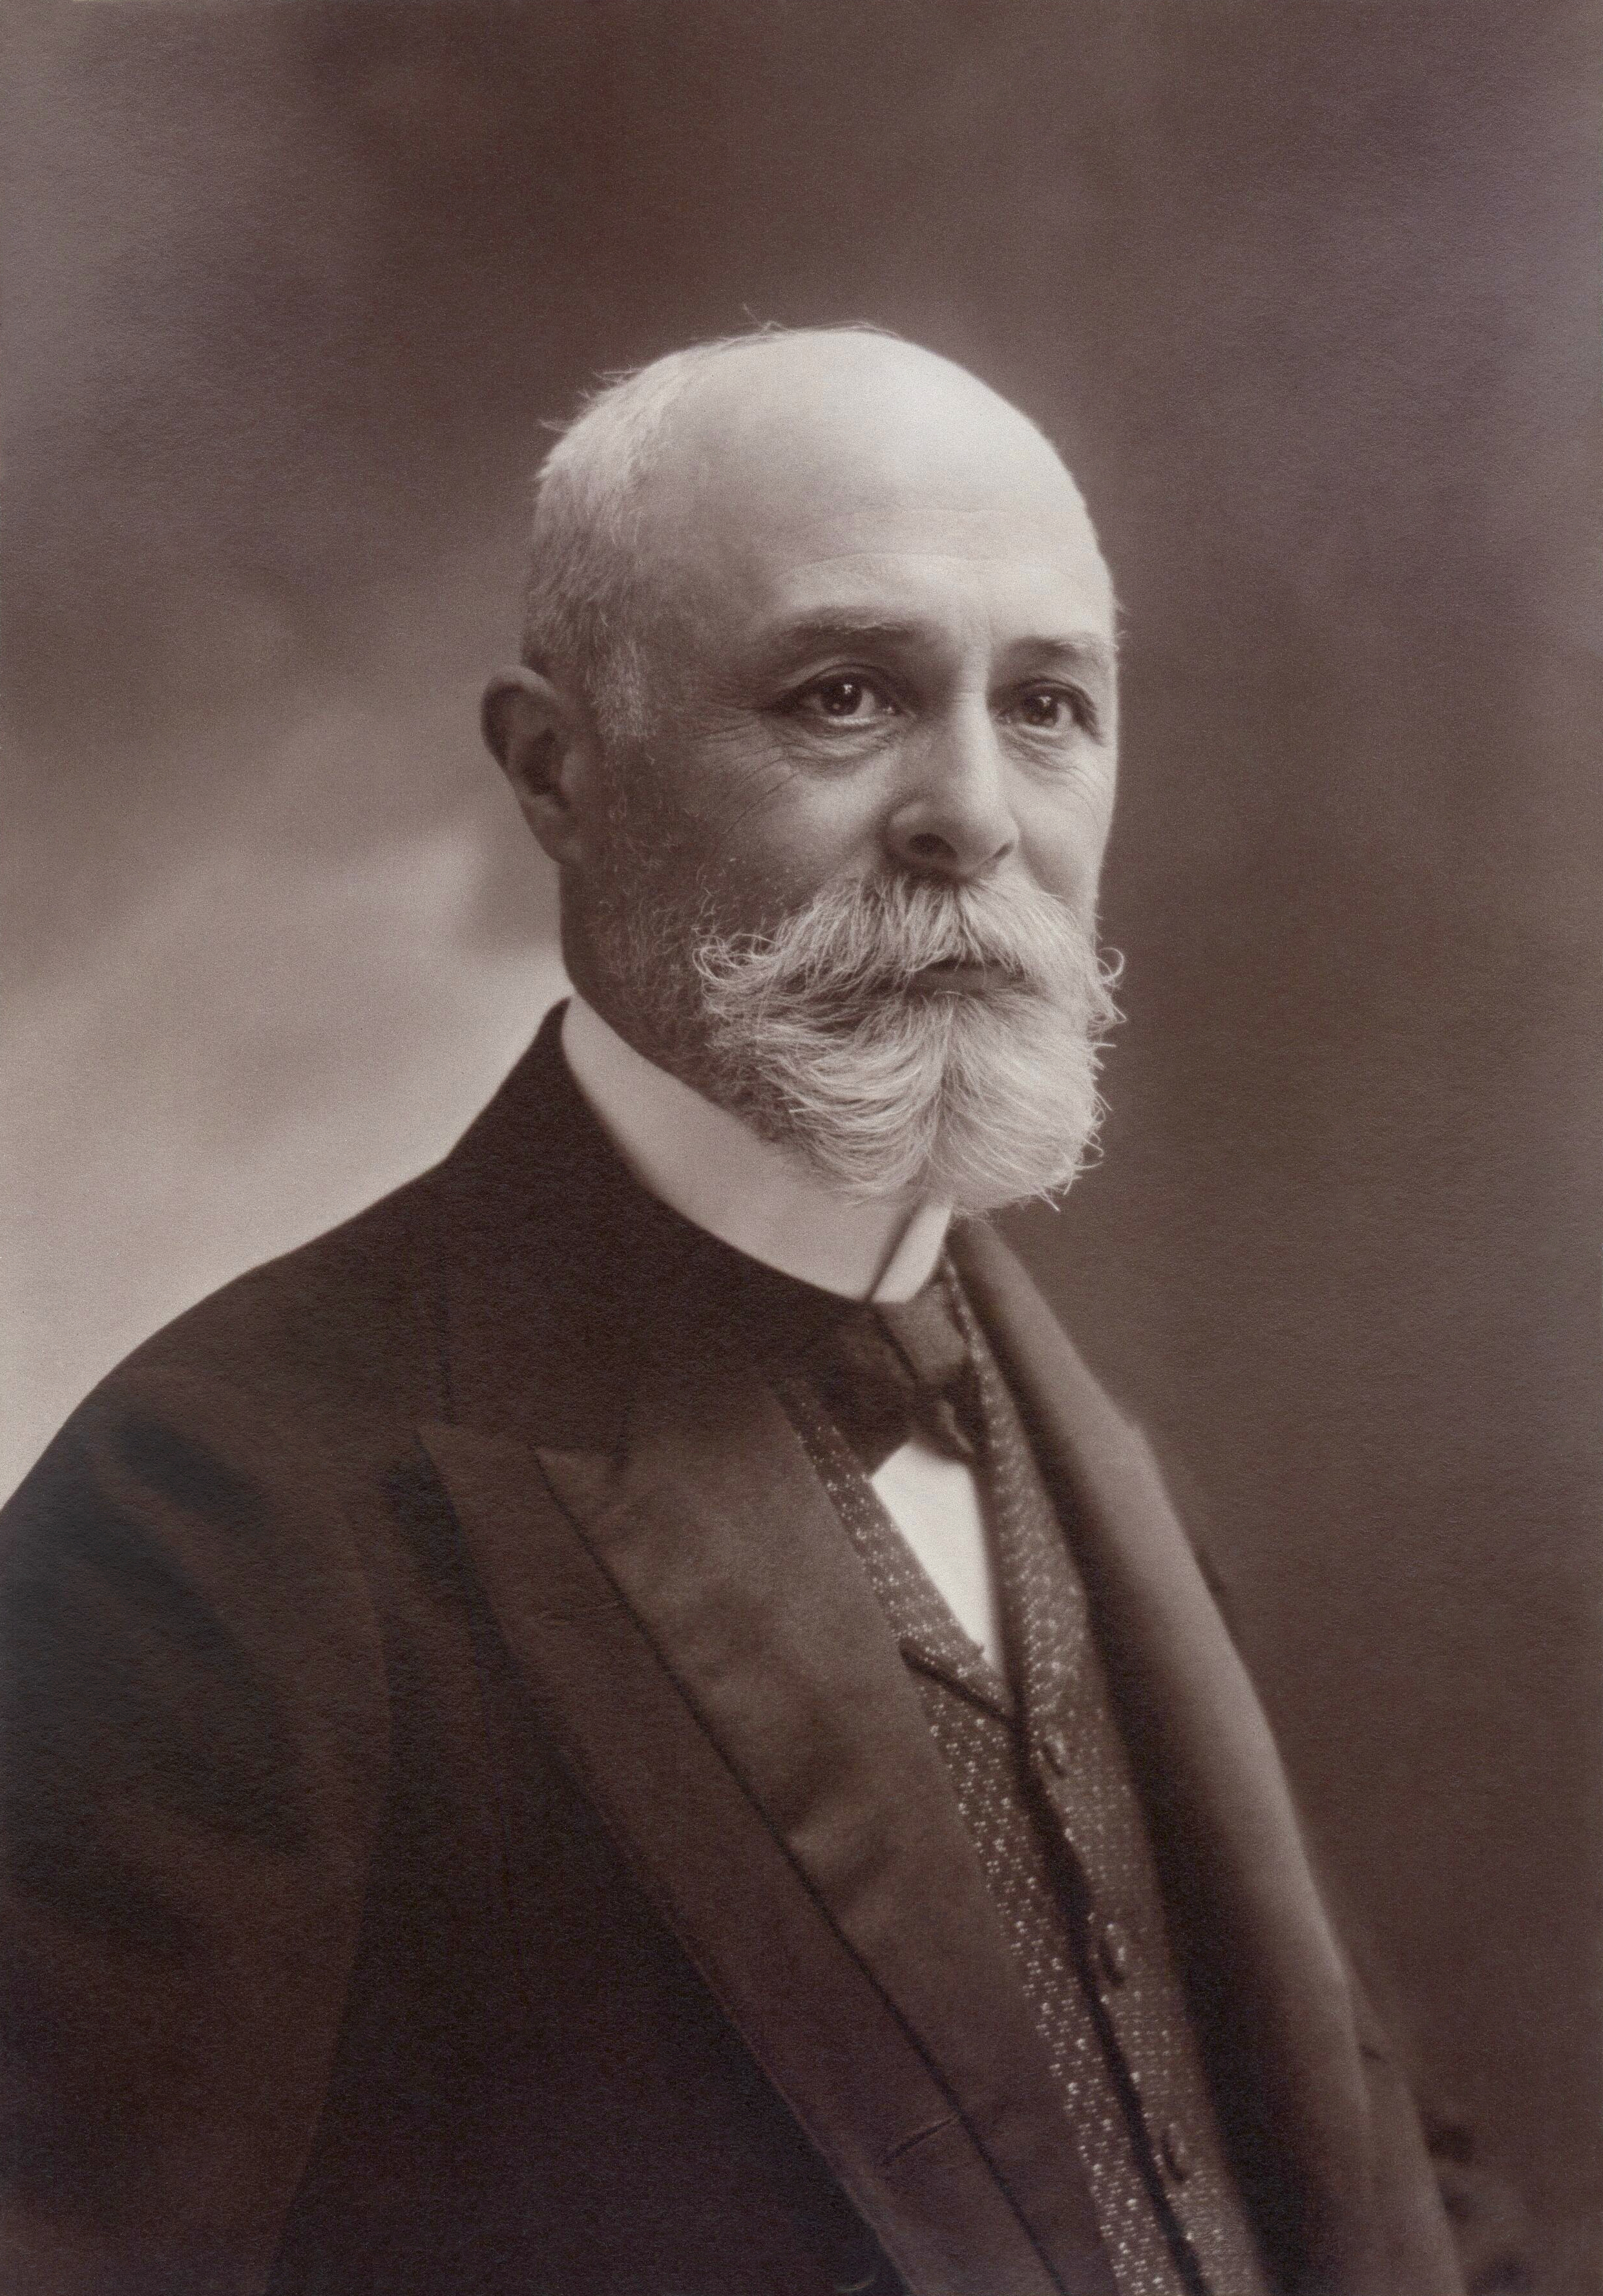
. Source. Like all big names in science, she was at the right place at the right time and with the right interest and passion.
Notably, the man she married, Pierre Curie, happened to be a the world master at precisely the technique that she needed to carefully measure radioactivity: he had the most precise electrometers in the world, which allowed to detect small amounts of radioactivity via the ionization of air by radiation . These used piezoelectricity, which Pierre Curie co-discovered with his brother.

Marie Curie c. 1920
. Source. 
Some of Feynman's key characteristics are:
- obsession with understanding the experiments well, see also Section "How to teach and learn physics"
- when doing more mathematical stuff, analogous obsession about starting with a concrete example and then generalizing that into the theory
- liked to teach others. At Surely You're Joking, Mr. Feynman for example he mentions that one key problem of the Institute for Advanced Study is that they didn't have to teach, and besides that making you feel useless when were not having new ideas, it is also the case that student's questions often inspire you to look again in some direction which sometimes happens to be profitableHe hated however mentoring others one to one, because almost everyone was too stupid for him
- interest in other natural sciences, and also random art and culture (and especially if it involves pretty women)
Some non-Physics related ones, mostly highlighted at Genius: Richard Feynman and Modern Physics by James Gleick (1994):
- Feynman was a huge womanizer during a certain period of his life
- he hated pomp, going as far as seeming uneducated to some people in the way he spoke, or going out of his way to look like that. This is in stark contrast to "rivals" Murray Gell-Mann and Julian Schwinger, who were posh/snobby.
Even Apple thinks so according to their Think different campaign: www.feynman.com/fun/think-different/
quantum electrodynamics lectures:
Feynman was apparently seriously interested/amused by computer:
- Video "Los Alamos From Below by Richard Feynman (1975)" see description for the human emulator
- quantum computers as experiments that are hard to predict outcomes was first attributed to Feynman
- www.youtube.com/watch?v=EKWGGDXe5MA Richard Feynman Computer Heuristics Lecture (1986)
Two official websites?
- www.richardfeynman.com/ this one has clearly superior scientific information.
- www.feynman.com/
In 1948 he published his reworking of classical quantum mechanics in terms of the path integral formulation: journals.aps.org/rmp/abstract/10.1103/RevModPhys.20.367 Space Time Approach to nonrelativistic quantum mechanics (paywalled 2021)
The natural sciences are not just a tool to predict the future.
They are a reminder that the lives that we live daily are mere illusions, religious concepts such as Maya and Samsara come to mind.
We as individuals perceive nothing about the materials that we touch every day really work, nor more importantly how our brain and cell work.
Everything is magic out of our control.
The natural sciences allow us peek, with huge concentrated effort, into tiny little bits a little of those unknowns, and blow our minds as we notice that we don't know anything.
For all practical purposes in life, there is a huge macro micro gap. We are only able to directly perceive and influence the macro events. And through those we try to affect micro events. Because for good or bad, micro events reflect in the macro world.
It is as if we live in a different plane of existence above molecules, and below galaxies. The hierarchy of Figure "xkcd 435: Fields arranged by purity" puts that nicely into perspective, shame it only starts at the economical level, not going up to astronomy.
The great beauty of science is that it allows us to puncture through some of the layers of reality, either up or down, away from our daily experience.
And the great beauty of artificial intelligence research is that it allows to peer deeper into exactly our layer of existence.
Every one or two weeks Ciro Santilli remembers that he and everything he touches are just a bunch of atoms, and that is an amazing feeling. This is Ciro's preferred source of Great doubt. Another concept that comes to mind is when you see it, you'll shit bricks.
Perhaps, the feeling of physics and the illusion of life reaches its peak in molecular biology.
Just look at your fucking hand right now.
Do you have any idea of each of the cells in it work? Isn't is at least 100 times more complex than the materials of the table you hand is currently resting on?
This is the non-science fiction version of the lotus-Eater Machine.
Alan Watts's "Philosopher" talk mentions related ideas:
The origin of a person who is defined as a philosopher, is one who finds that existence itself is exceedingly odd.
The toddler of a friend of Ciro Santilli's wife asked her mum:Our perception of the macroscopic world is so magic that children have to learn the difference between living and non-living things.
James Somers put it very well as well in his article I should have loved biology by James Somers, this quote was brought to Ciro's attention by Bert Hubert's website[ref].The same applies to other natural sciences.
I should have loved biology but I found it to be a lifeless recitation of names: the Golgi apparatus and the Krebs cycle; mitosis, meiosis; DNA, RNA, mRNA, tRNA.In the textbooks, astonishing facts were presented without astonishment. Someone probably told me that every cell in my body has the same DNA. But no one shook me by the shoulders, saying how crazy that was. I needed Lewis Thomas, who wrote in The Medusa and the Snail:For the real amazement, if you wish to be amazed, is this process. You start out as a single cell derived from the coupling of a sperm and an egg; this divides in two, then four, then eight, and so on, and at a certain stage there emerges a single cell which has as all its progeny the human brain. The mere existence of such a cell should be one of the great astonishments of the earth. People ought to be walking around all day, all through their waking hours calling to each other in endless wonderment, talking of nothing except that cell.
Alan Watts' "Philosopher" talk (1973)
Source. Lecture given at UCLA on 1973-02-21. Some key quotes from the talk:The origin of a person who is defined as a philosopher, is one who finds that existence itself is exceedingly odd.
Quantum mechanics is quite a broad term. Perhaps it is best to start approaching it from the division into:
- non-relativistic quantum mechanics: obviously the simpler one, and where you should start
- relativistic quantum mechanics: more advanced, and arguably "less useful"
Key experiments that could not work without quantum mechanics: Section "Quantum mechanics experiment".
Mathematics: there are a few models of increasing precision which could all be called "quantum mechanics":
Ciro Santilli feels that the largest technological revolutions since the 1950's have been quantum related, and will continue to be for a while, from deeper understanding of chemistry and materials to quantum computing, understanding and controlling quantum systems is where the most interesting frontier of technology lies.
There are unlisted articles, also show them or only show them.