Topics (203k) Articles (205k) Users (298) Discussions (237) Comments (383) Files (715) New article

Tactile graphics are visual representations designed to be interpreted through touch rather than sight. They are typically used to convey information to individuals who are visually impaired or blind, providing them with a way to access graphical information that would normally be seen. These graphics utilize raised lines, textures, and various materials to represent shapes, patterns, and important details. For example, a tactile graphic of a map might include raised paths and textured areas to represent different terrains, allowing users to explore the layout through touch.
Superimposition refers to the process of placing one element over another in such a way that the two elements coexist, allowing for comparison or a combined effect. This term can be applied in various fields, such as: 1. **Art and Design**: In visual arts, superimposition might involve layering images or patterns to create new visual compositions.
Styled Layer Descriptor (SLD) is an XML-based markup language used to define the visual styling of geospatial data in web mapping applications. It is part of the Open Geospatial Consortium (OGC) standards and is primarily used with Web Map Services (WMS) to specify how map layers should be rendered. SLD allows users to create detailed and customized styles for geographic data by defining rules, symbols, colors, and other visual properties.
A stereoautograph is a specialized device used primarily in the field of stereo photography and 3D imaging. It typically refers to a machine or system that can create stereo images, which provide a sense of depth by displaying two slightly different perspectives of the same scene, mimicking the way human eyes perceive depth.
The Steinhaus longimeter is a mathematical tool used primarily in the field of geometric measurements. It is designed to measure lengths in a more versatile and flexible manner than traditional measuring devices. The longimeter allows for the determination of the length of curves and complex shapes, which can be particularly useful in both theoretical and applied mathematics. The device operates on principles of geometry and can be particularly advantageous for tasks that involve irregular or non-linear measurements.
Spatial scale refers to the physical dimensions or extent of a geographic area being studied or analyzed. It is a critical concept in various fields, including geography, ecology, urban planning, and remote sensing, as it influences the patterns and processes observed in spatial data. Spatial scale can be characterized in several ways: 1. **Map Scale**: This refers to the ratio of a distance on a map to the corresponding distance on the ground. A small-scale map shows a larger area with less detail (e.
The Spatial Data Transfer Standard (SDTS) is a standard developed by the U.S. federal government for the transfer of spatial data between different computer systems, primarily used in geographic information systems (GIS). It was created to enhance interoperability and facilitate the sharing of geospatial data among various users and applications. Key characteristics of SDTS include: 1. **Interoperability**: SDTS provides a standardized format that enables different systems to understand and process spatial data without the need for special translation mechanisms.
Sociomapping is a visual and analytical technique used to map and understand the relationships, interactions, and dynamics within a group or organization. It allows individuals and organizations to visualize patterns of communication, collaboration, and influence among members. The process typically involves gathering data through surveys, interviews, or observations, which is then represented in a visual format, such as diagrams or maps.
Scribing in the context of cartography refers to the process of creating maps or drawing them by hand, often with a focus on precision and detail. This traditional method of map-making involves the use of tools like compasses, rulers, and writing instruments to produce accurate representations of geographical areas. In more modern contexts, scribing can also refer to the digital process of creating maps using software, but the term itself is rooted in the hand-drawn techniques of early cartography.
Scale on a map refers to the relationship between distances on the map and actual distances on the ground. It provides a way to understand how much the features on the map have been reduced in size compared to their real-world counterparts. There are a few common ways to express scale: 1. **Graphic Scale (Bar Scale)**: A visual representation of scale, usually depicted as a line or bar divided into segments, each representing a specific distance (e.g.
A sand table is a type of model or simulation tool typically used in education, military training, and planning exercises. It consists of a flat surface filled with sand and can be used to create topographical representations of terrain. The sand can be shaped and manipulated to illustrate different landscapes, which helps in visualizing and understanding geographical features and tactical movements. **Applications of Sand Tables:** 1. **Military Training:** Sand tables are often used by military units for tactical training and planning exercises.
In nautical terms, a "rutter" refers to a navigational guide or manual that contains information about coastal areas, regions, or specific sea routes. Historically, rutters were important for navigation, especially before the advent of modern navigational tools and GPS. They typically included details such as descriptions of routes, landmarks, water depths, tidal information, currents, and other critical data useful for mariners to safely guide their vessels.
The Rule of Marteloio, often referred to in the context of finance or economics, pertains to the trade of goods and services, particularly in markets where commodities are subject to fluctuations due to varying factors such as supply and demand.
Rubbersheeting is a term used primarily in the context of **cartography** and **geographic information systems (GIS)**. It refers to a process of manipulating a map or image to correct distortions, align it more closely with another map or coordinate system, or adjust the scale of the image. This technique is especially useful when dealing with historical maps, aerial photographs, or satellite imagery that may not be perfectly aligned with contemporary geographic data.
The Royal Corps of Military Surveyors and Draftsmen (RCMSD) is a branch of the British Army that specializes in surveying, mapping, and drafting tasks. Its personnel are responsible for providing geospatial information and technical support for military operations. This includes creating maps, plans, and drawings that assist in operational planning and decision-making. The RCMSD plays a crucial role in ensuring that the military has accurate geographical data, which is vital for logistics, strategy, and tactical movements.
"Romer" can refer to several different things, depending on the context. Here are a few possibilities: 1. **Paul Romer**: An American economist known for his work in endogenous growth theory, which emphasizes the role of technology and innovation in economic growth. He was awarded the Nobel Prize in Economic Sciences in 2018. 2. **Romer’s theorem**: In mathematics, particularly in graph theory, this theorem pertains to the colorability of graphs.
Rome2Rio is a travel planning platform that helps users find the best routes and transportation options between destinations. Launched in 2010, it aggregates various modes of transportation, including flights, trains, buses, ferries, and driving directions, allowing users to compare different travel options based on time, cost, and convenience. The website and mobile app provide users with detailed information about schedules, ticket prices, and connections, making it a valuable resource for travelers looking to plan their journeys efficiently.
Robotic mapping refers to the process by which mobile robots create a representation of their environment, typically using spatial data. This representation can take various forms, such as maps that outline physical features, obstacles, or pathways that a robot needs to navigate. The mapping process is an essential component of robotics and is often coupled with navigation and localization tasks.
A Rhumbline network, often referred to in maritime or navigational contexts, involves a system of paths that maintain a constant compass direction, known as a rhumb line or loxodrome. Unlike great circle routes, which represent the shortest path between two points on the surface of a sphere (like the Earth), rhumb lines traverse the sphere while keeping a constant bearing.
A Quadrilateralized Spherical Cube (QSC) is a geometric structure used in computer graphics, geospatial analysis, and computational geometry. It represents a method of mapping a spherical surface (like the surface of a sphere) to a cube-like structure while maintaining a quadrilateral (four-sided polygon) representation. The QSC is characterized by the following features: 1. **Cube-like Structure**: The QSC begins with the geometry of a cube.
Pinned article: Introduction to the OurBigBook Project
Welcome to the OurBigBook Project! Our goal is to create the perfect publishing platform for STEM subjects, and get university-level students to write the best free STEM tutorials ever.
Everyone is welcome to create an account and play with the site: ourbigbook.com/go/register. We belive that students themselves can write amazing tutorials, but teachers are welcome too. You can write about anything you want, it doesn't have to be STEM or even educational. Silly test content is very welcome and you won't be penalized in any way. Just keep it legal!
Intro to OurBigBook
. Source. We have two killer features:
- topics: topics group articles by different users with the same title, e.g. here is the topic for the "Fundamental Theorem of Calculus" ourbigbook.com/go/topic/fundamental-theorem-of-calculusArticles of different users are sorted by upvote within each article page. This feature is a bit like:
- a Wikipedia where each user can have their own version of each article
- a Q&A website like Stack Overflow, where multiple people can give their views on a given topic, and the best ones are sorted by upvote. Except you don't need to wait for someone to ask first, and any topic goes, no matter how narrow or broad
This feature makes it possible for readers to find better explanations of any topic created by other writers. And it allows writers to create an explanation in a place that readers might actually find it.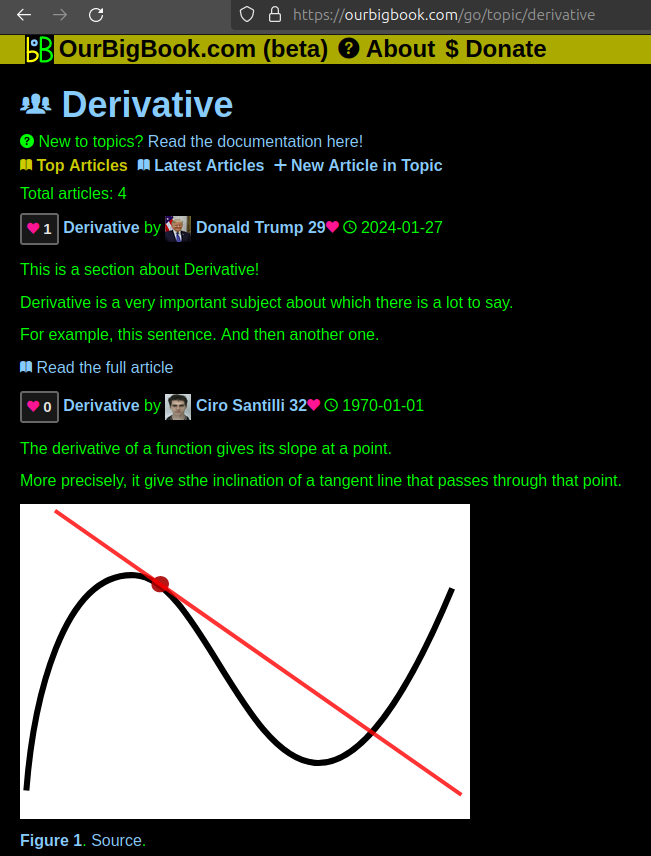
Figure 1. Screenshot of the "Derivative" topic page. View it live at: ourbigbook.com/go/topic/derivativeVideo 2. OurBigBook Web topics demo. Source. - local editing: you can store all your personal knowledge base content locally in a plaintext markup format that can be edited locally and published either:This way you can be sure that even if OurBigBook.com were to go down one day (which we have no plans to do as it is quite cheap to host!), your content will still be perfectly readable as a static site.
- to OurBigBook.com to get awesome multi-user features like topics and likes
- as HTML files to a static website, which you can host yourself for free on many external providers like GitHub Pages, and remain in full control
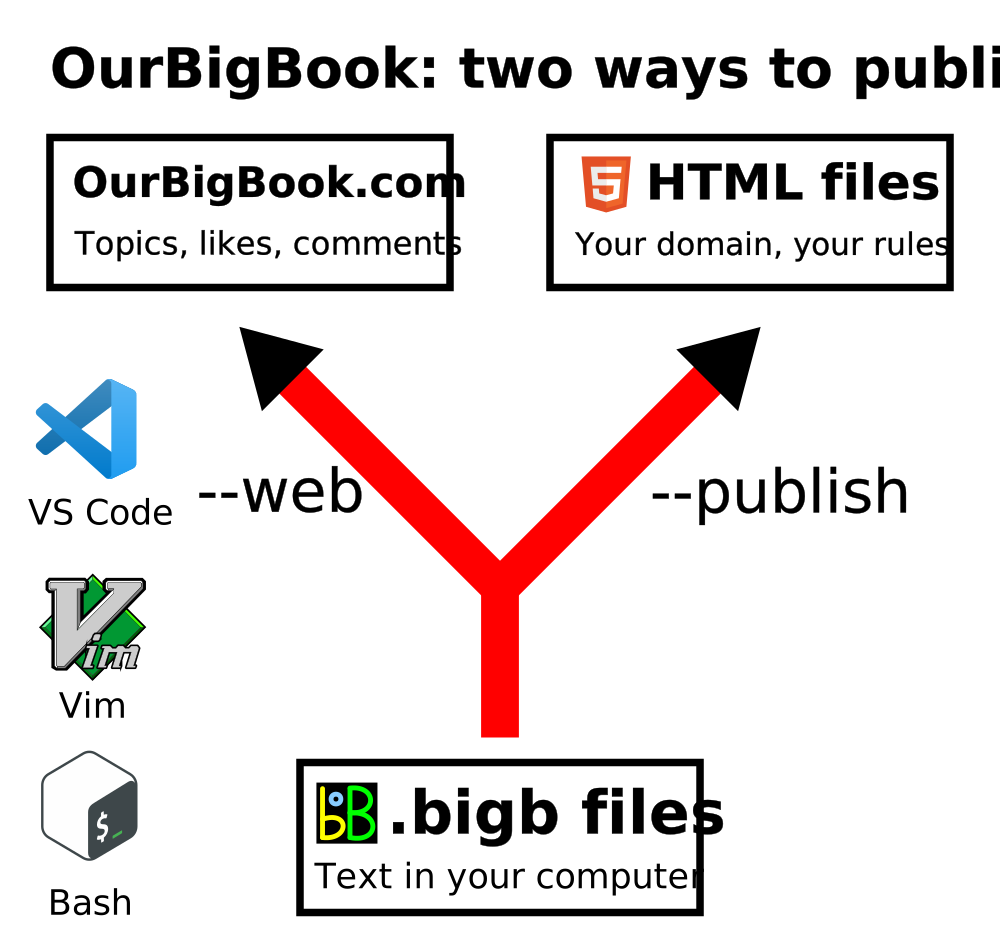
Figure 2. You can publish local OurBigBook lightweight markup files to either OurBigBook.com or as a static website.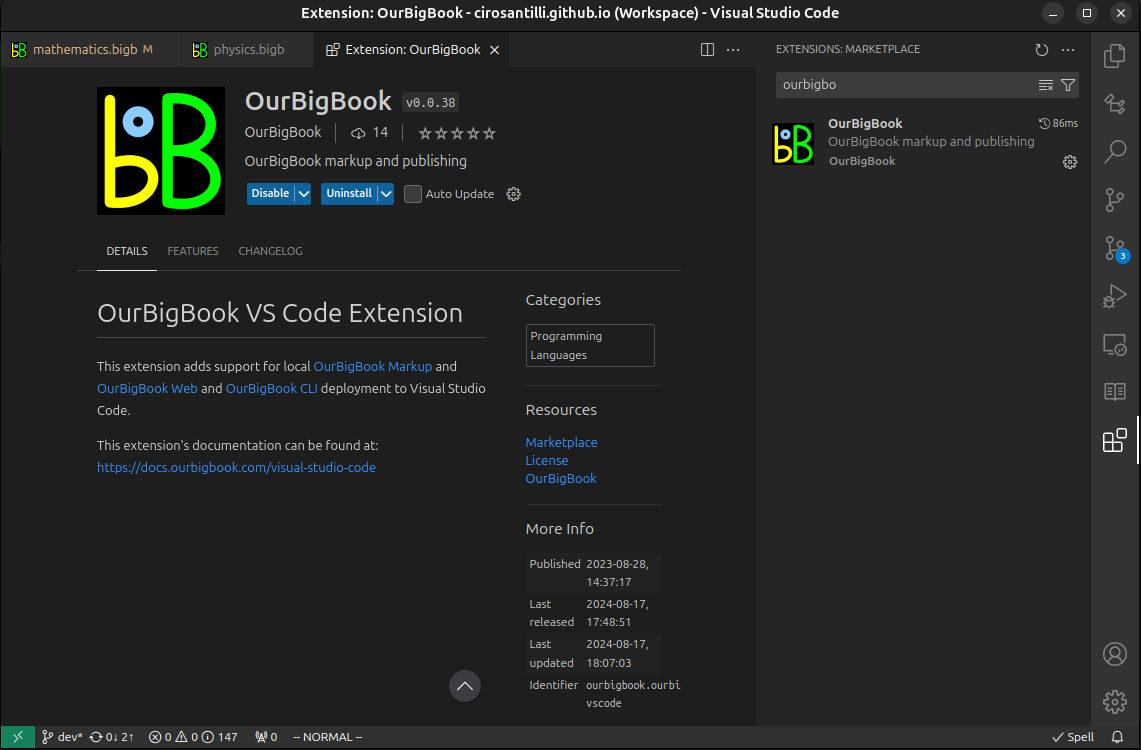
Figure 3. Visual Studio Code extension installation.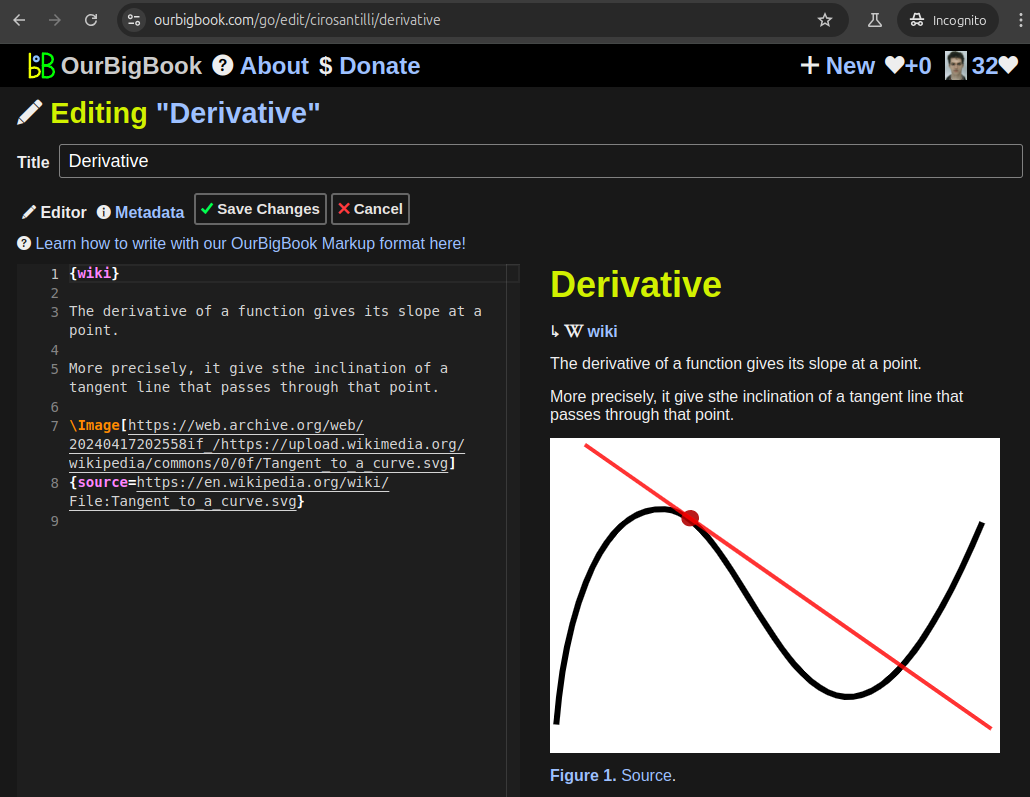
Figure 5. . You can also edit articles on the Web editor without installing anything locally. Video 3. Edit locally and publish demo. Source. This shows editing OurBigBook Markup and publishing it using the Visual Studio Code extension. 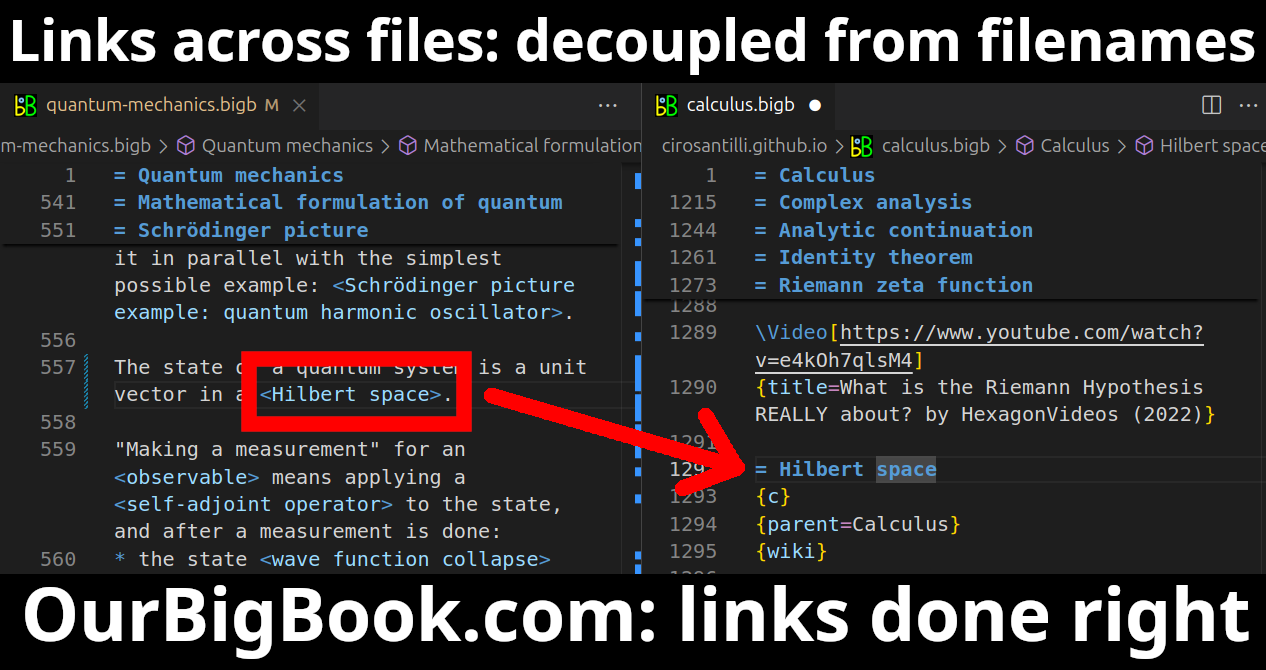
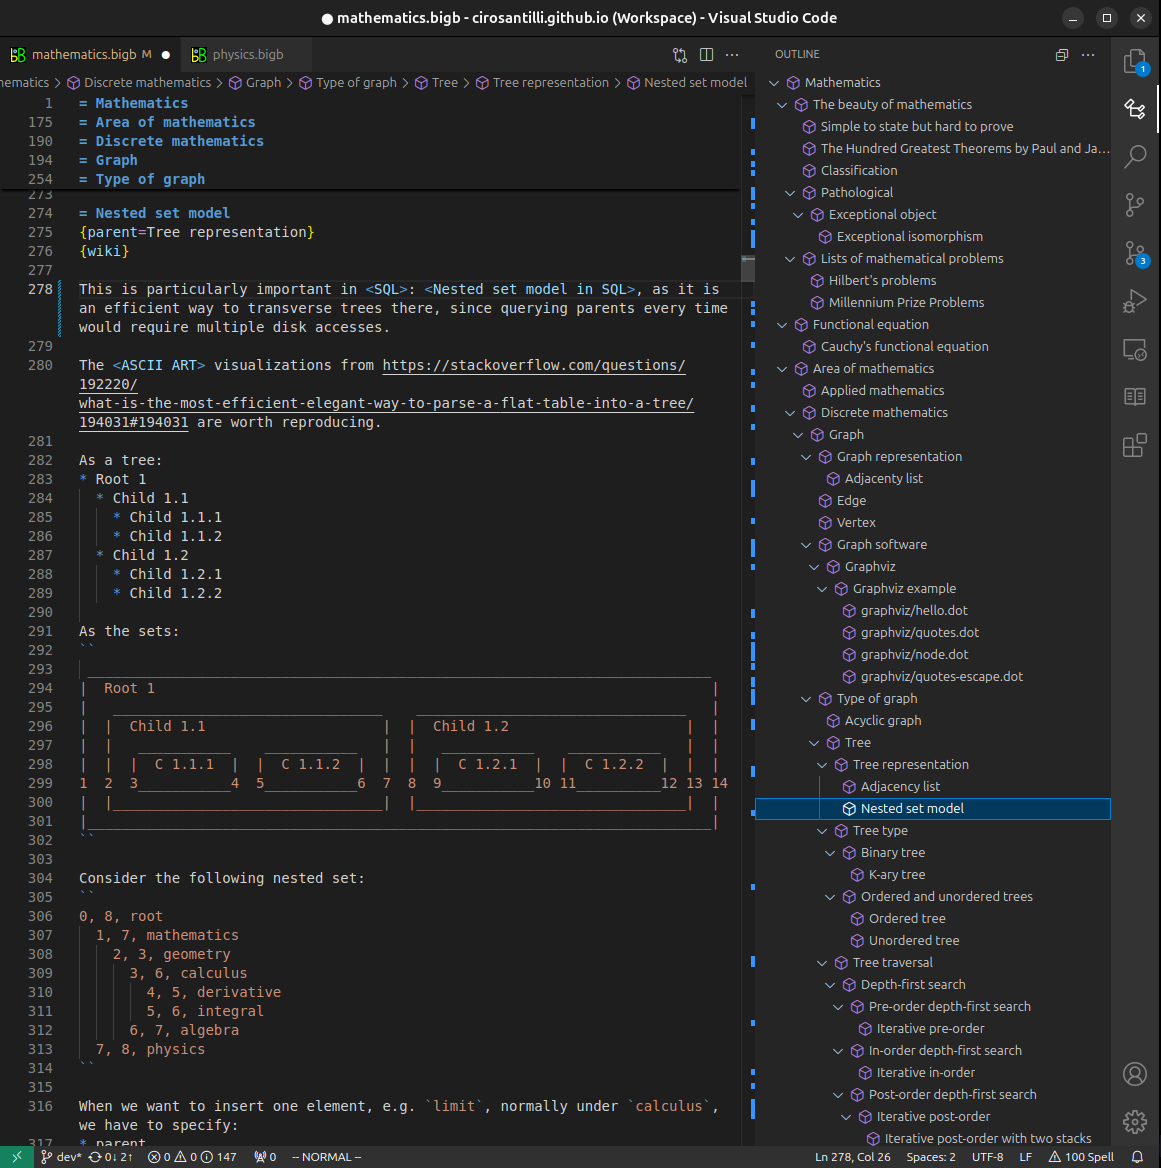
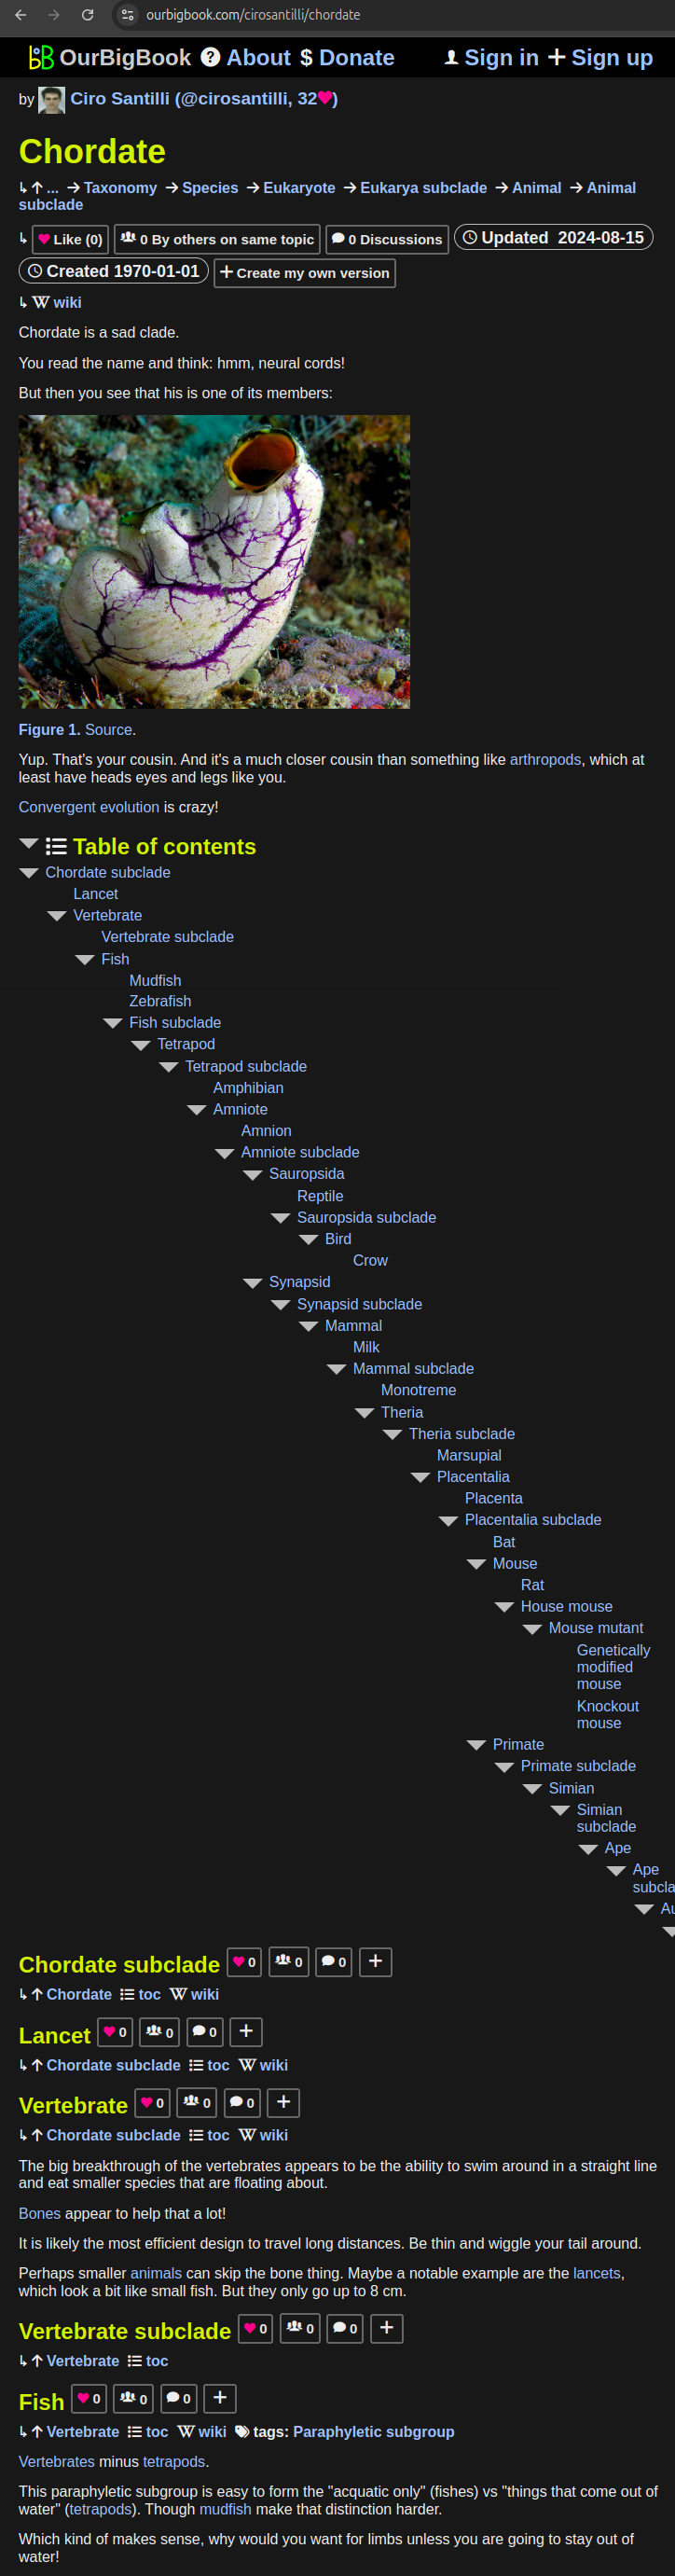
- Infinitely deep tables of contents:
All our software is open source and hosted at: github.com/ourbigbook/ourbigbook
Further documentation can be found at: docs.ourbigbook.com
Feel free to reach our to us for any help or suggestions: docs.ourbigbook.com/#contact