Topics (203k) Articles (205k) Users (298) Discussions (237) Comments (383) Files (715) New article

In cartography, a graticule is a network of latitude and longitude lines that create a coordinate system on a map or globe. These lines help to define locations on the Earth's surface by providing a reference framework for geographic coordinates. ### Key Features of Graticules: 1. **Latitude Lines (Parallels)**: These are horizontal lines that run east-west and measure the distance north or south of the Equator, which is at 0 degrees latitude.
In the context of a business or marketing segment, "Gore" usually refers to the Gore-Tex brand, which is associated with high-performance outdoor gear and clothing that incorporates waterproof and breathable materials. Gore-Tex is well-known for its innovative fabric technology that allows moisture to escape while keeping water out, making it popular among outdoor enthusiasts.
A Google Maps pin is a visual marker on the Google Maps interface that represents a specific location. These pins are often used to indicate points of interest, such as businesses, restaurants, landmarks, or addresses. When users search for locations or explore the map, pins help them quickly identify where these places are located. In addition to the standard markers, Google Maps allows users to customize their own pins when creating or sharing maps, enabling them to highlight particular areas or provide directions to specific spots.
The term "Global Relief Model" doesn't refer to a widely recognized or standardized concept, but it can pertain to various frameworks and strategies used in humanitarian aid and disaster relief efforts on a global scale. In general, a global relief model is designed to optimize and coordinate the distribution of resources, support, and assistance in response to crises, natural disasters, or humanitarian needs across countries and regions.
The German Cartographic Society, known as "Deutsche Gesellschaft für Kartographie" (DGfK), is a professional organization dedicated to the field of cartography in Germany. Established in 1952, the society aims to promote the science and art of map-making, geographic information systems (GIS), and related disciplines.
Geovisualization is the process of using visual representations to explore, analyze, and communicate geographical information and spatial data. It integrates geographic information systems (GIS) with visualization techniques to help users understand complex datasets and spatial relationships more effectively. Key components of geovisualization include: 1. **Data Representation**: Using maps, charts, graphs, and 3D models to represent spatial data clearly and effectively.
Geospatial topology refers to the study and representation of spatial relationships between geographic features in a spatial dataset. It focuses on the properties of space that remain invariant under transformations, such as the relationships and connections between different spatial entities—even when their positions or shapes change. In geospatial contexts, topology is essential for understanding how geographic features interact with each other.
Geomontography is a term that refers to the study and representation of the Earth's mountains and topography, combining elements of geology, geography, and cartography. While it is not a widely recognized or standard term in academic or professional circles, it can describe the art and science of mapping, analyzing, and interpreting mountainous terrains, including their formation, structure, and impact on the environment and human activities.
GeoTime is a software application designed for visualizing and analyzing spatiotemporal data, which refers to data that has both a geographical (spatial) component and a time (temporal) component. It allows users to explore complex datasets by mapping them in a 3D environment, enabling them to analyze patterns over time and space. GeoTime is particularly useful for fields such as law enforcement, environmental studies, and transportation, where understanding the relationship between locations and time is crucial.
GeoTIFF is a public raster file format that allows georeferencing information to be embedded within a TIFF (Tagged Image File Format) file. This means that it not only stores image data (such as maps or satellite images) but also carries information about the geographical coordinates and projection systems used, enabling the image to be accurately placed on the Earth's surface.
GeoPlanet is a data platform developed by Yahoo (formerly part of Oath and Verizon Media) that provides a comprehensive database of geographical and location-based information. It offers a wide range of geospatial data, including details about places, neighborhoods, landmarks, and geographical features across the globe. The platform is designed to allow developers to incorporate location-based services into their applications, enabling features such as place search, geocoding, and geographic data analysis.
The concept of the "fundamental plane" is commonly discussed in the context of astronomy and astrophysics, particularly in relation to galaxies. However, when it comes to spherical coordinates themselves, the term may not have a widely recognized or specific meaning. ### General Explanation: In spherical coordinates, a point in three-dimensional space is described by three parameters: 1. **Radial distance** (\( r \)): The distance from the origin to the point.
Flight traffic mapping refers to the visualization and analysis of air traffic patterns and movements of aircraft within a specific airspace or region. This can involve the use of various tools and technologies to display real-time or historical data related to flights, including their paths, altitudes, speeds, and destinations.
Figure-ground is a concept in cartography and visual perception that refers to the way objects (the "figure") are distinguished from their background (the "ground"). In cartography, this concept is crucial for creating effective maps that clearly communicate spatial information. **Key Aspects of Figure-Ground in Cartography:** 1. **Contrast and Clarity:** The figure (features like roads, rivers, and buildings) should stand out against the ground (background elements like land cover or water bodies).
Feature data refers to the individual measurable properties or characteristics of a phenomenon being observed in a dataset. In the context of machine learning and data science, features are the input variables used to make predictions or classifications. Each feature represents a piece of information that can help describe the data point or observation. Here are a few key points about feature data: 1. **Types of Features**: Features can be of various types, including: - **Numerical Features**: Continuous data (e.g.
The term "European grid" can refer to several different concepts depending on the context. Here are a couple of common interpretations: 1. **European Electricity Grid**: This is the interconnected electrical grid that spans various countries in Europe. It allows electricity to be transmitted across borders, facilitating the integration of renewable energy sources and improving overall energy security and reliability.
The term "drying height" can refer to a few different concepts depending on the context, but it is most commonly associated with agriculture, horticulture, and food processing. Here are a couple of interpretations: 1. **Agricultural Context**: In agriculture, drying height may refer to the vertical height at which crops (especially grains or forage) are placed during the drying process to facilitate air circulation and moisture removal.
A Digital Raster Graphic (DRG) is a type of digital image that represents rasterized data, typically derived from scanned maps or other source documents. DRGs are commonly used in geographic information systems (GIS) and cartography to provide a digital version of paper maps or aerial photographs. The key characteristics of DRGs include: 1. **Raster Format**: This means that the image is composed of a grid of pixels, where each pixel represents a color or a value.
A digital line graph is a graphical representation of data that shows trends over time or sequences. It typically consists of points plotted on a coordinate system, connected by straight lines, to illustrate changes in values across a given period or across different categories. Digital line graphs are widely used in various fields such as finance, science, and statistics to visualize data trends, compare different sets of data, and make interpretations more accessible.
Pinned article: Introduction to the OurBigBook Project
Welcome to the OurBigBook Project! Our goal is to create the perfect publishing platform for STEM subjects, and get university-level students to write the best free STEM tutorials ever.
Everyone is welcome to create an account and play with the site: ourbigbook.com/go/register. We belive that students themselves can write amazing tutorials, but teachers are welcome too. You can write about anything you want, it doesn't have to be STEM or even educational. Silly test content is very welcome and you won't be penalized in any way. Just keep it legal!
Intro to OurBigBook
. Source. We have two killer features:
- topics: topics group articles by different users with the same title, e.g. here is the topic for the "Fundamental Theorem of Calculus" ourbigbook.com/go/topic/fundamental-theorem-of-calculusArticles of different users are sorted by upvote within each article page. This feature is a bit like:
- a Wikipedia where each user can have their own version of each article
- a Q&A website like Stack Overflow, where multiple people can give their views on a given topic, and the best ones are sorted by upvote. Except you don't need to wait for someone to ask first, and any topic goes, no matter how narrow or broad
This feature makes it possible for readers to find better explanations of any topic created by other writers. And it allows writers to create an explanation in a place that readers might actually find it.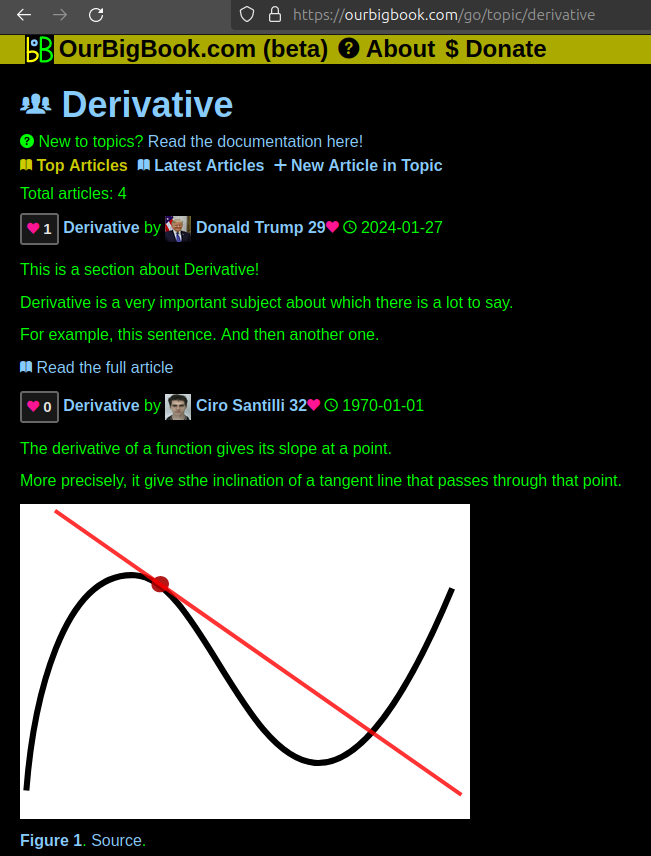
Figure 1. Screenshot of the "Derivative" topic page. View it live at: ourbigbook.com/go/topic/derivativeVideo 2. OurBigBook Web topics demo. Source. - local editing: you can store all your personal knowledge base content locally in a plaintext markup format that can be edited locally and published either:This way you can be sure that even if OurBigBook.com were to go down one day (which we have no plans to do as it is quite cheap to host!), your content will still be perfectly readable as a static site.
- to OurBigBook.com to get awesome multi-user features like topics and likes
- as HTML files to a static website, which you can host yourself for free on many external providers like GitHub Pages, and remain in full control
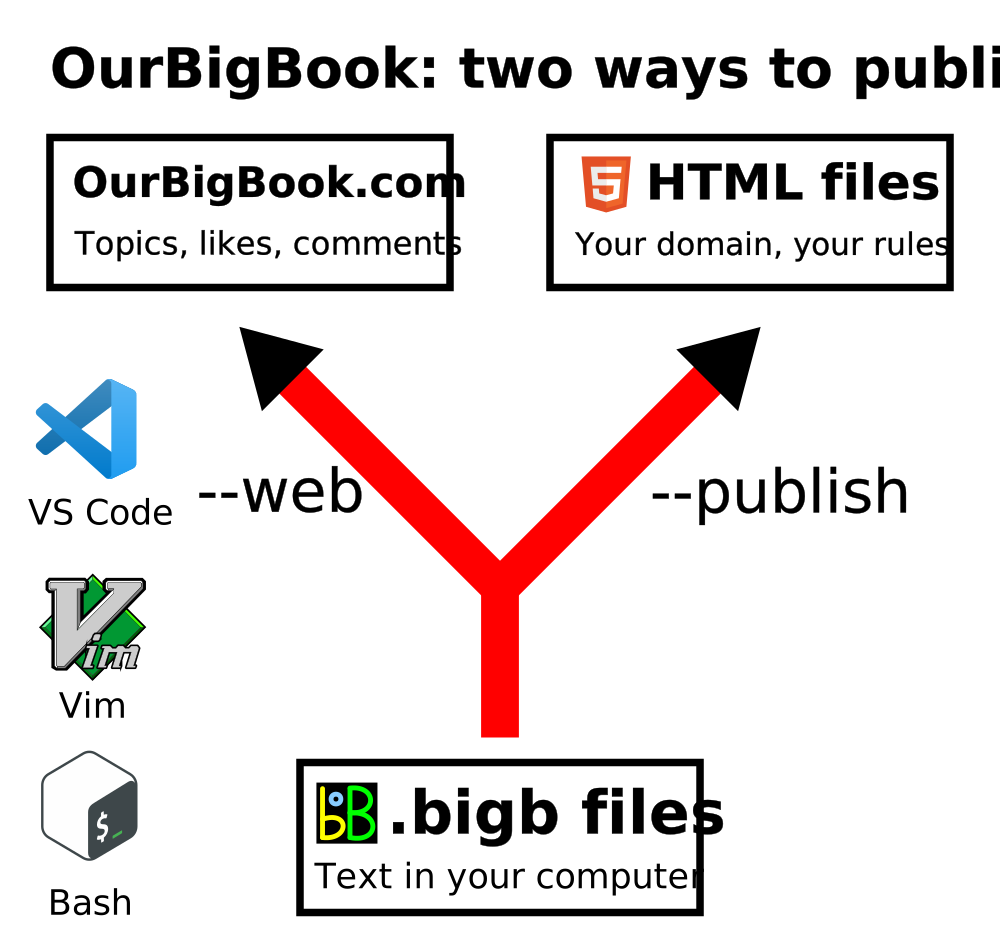
Figure 2. You can publish local OurBigBook lightweight markup files to either OurBigBook.com or as a static website.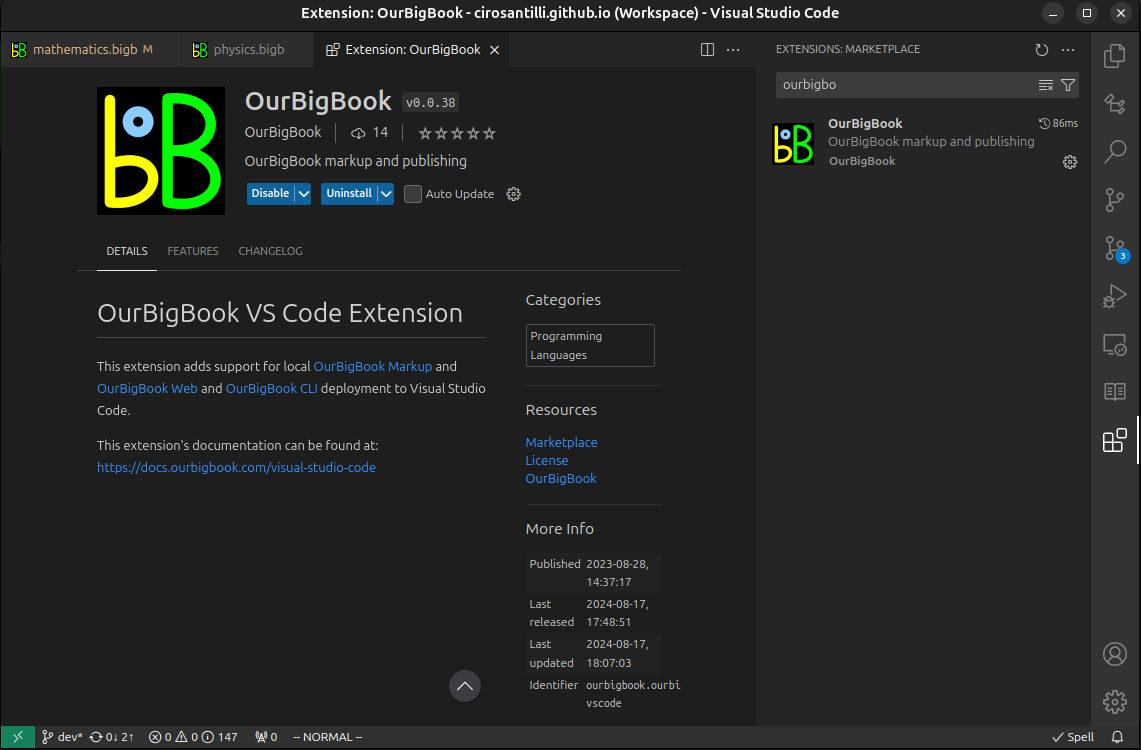
Figure 3. Visual Studio Code extension installation.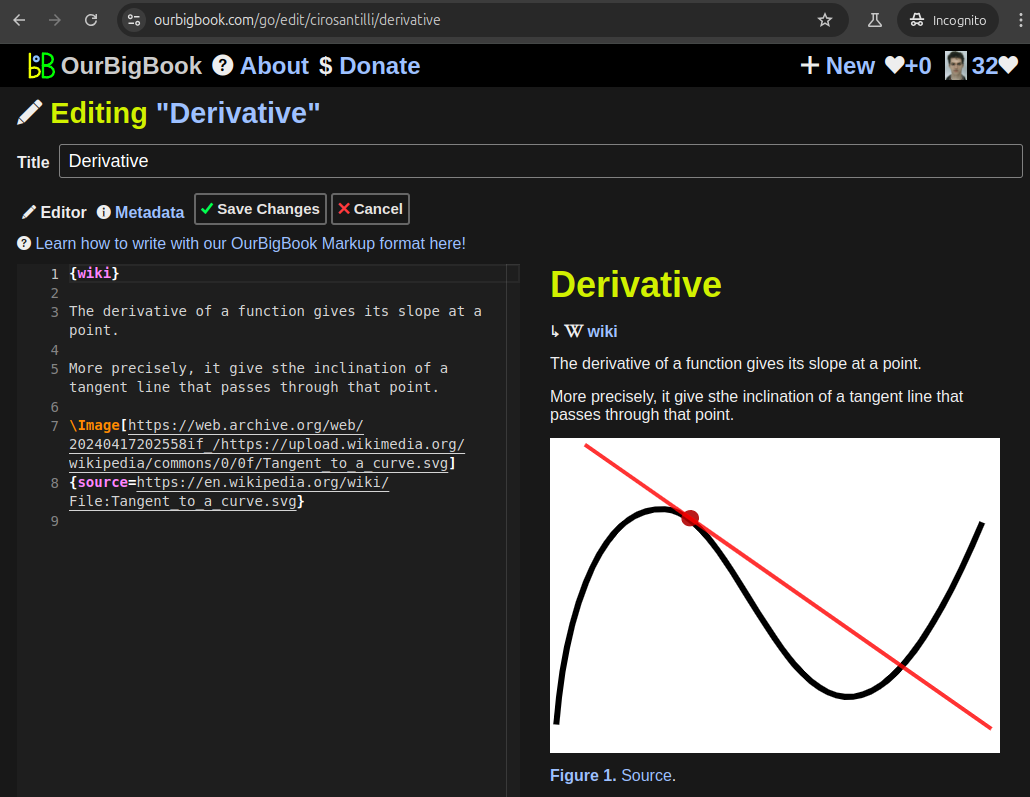
Figure 5. . You can also edit articles on the Web editor without installing anything locally. Video 3. Edit locally and publish demo. Source. This shows editing OurBigBook Markup and publishing it using the Visual Studio Code extension. 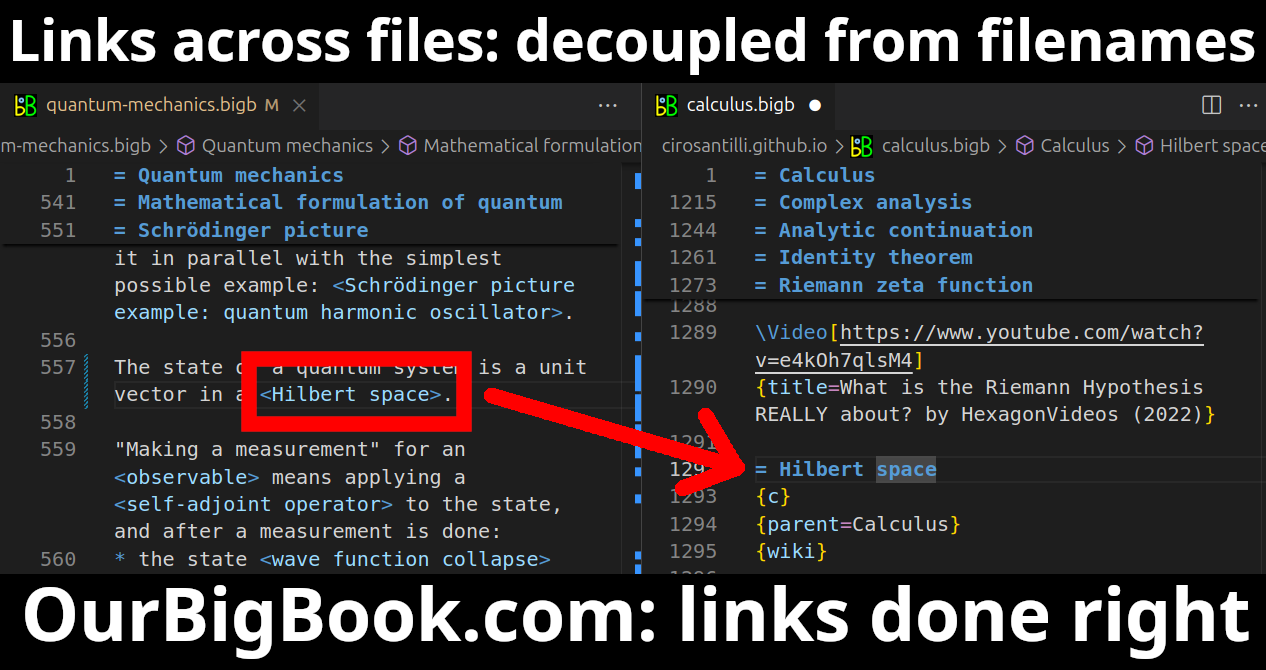
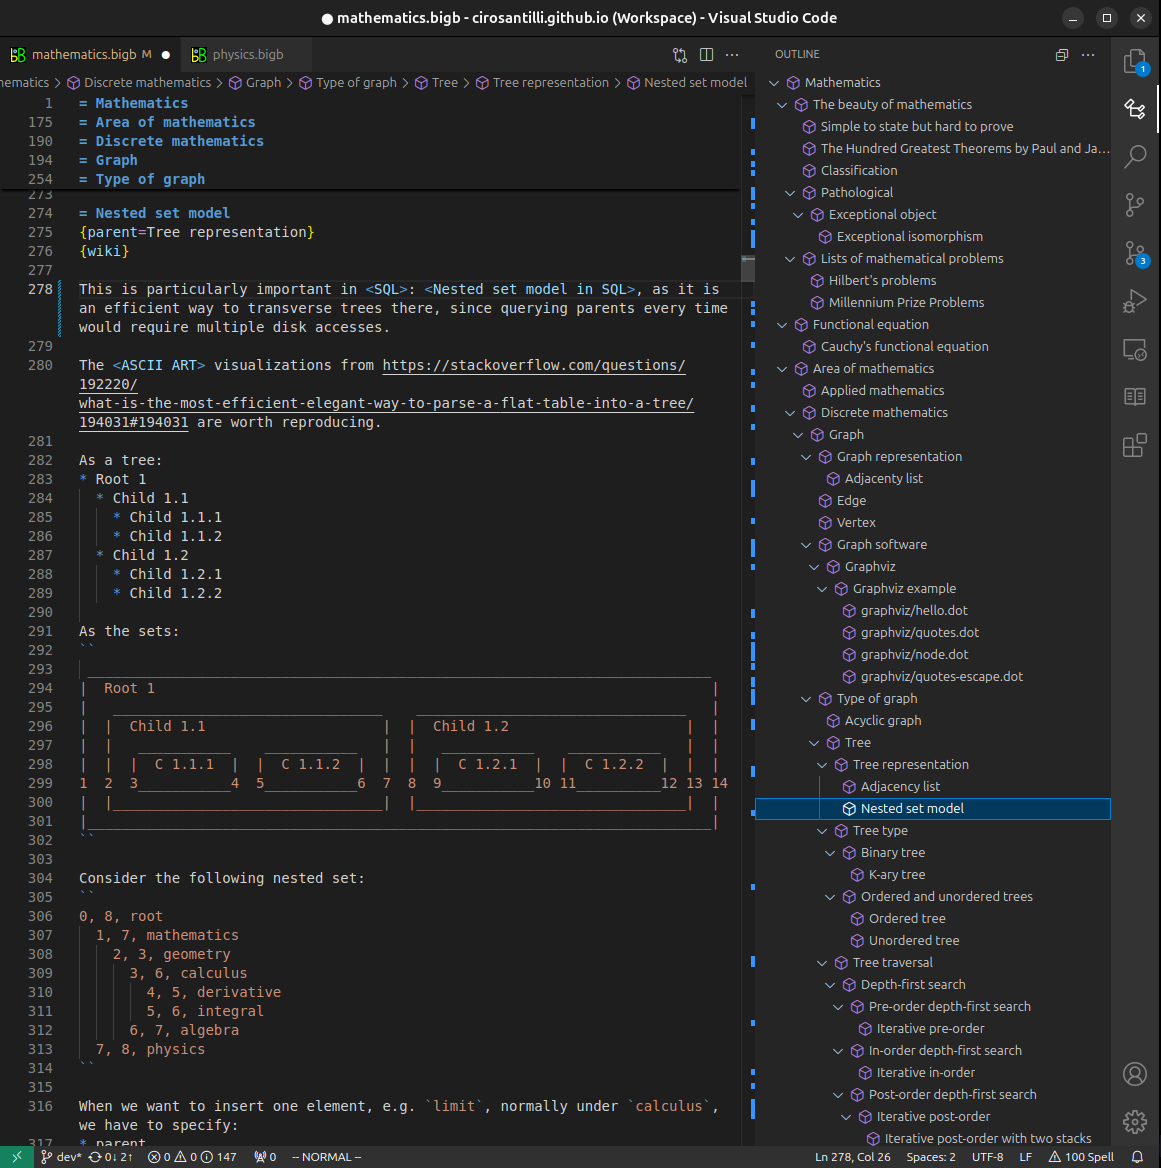
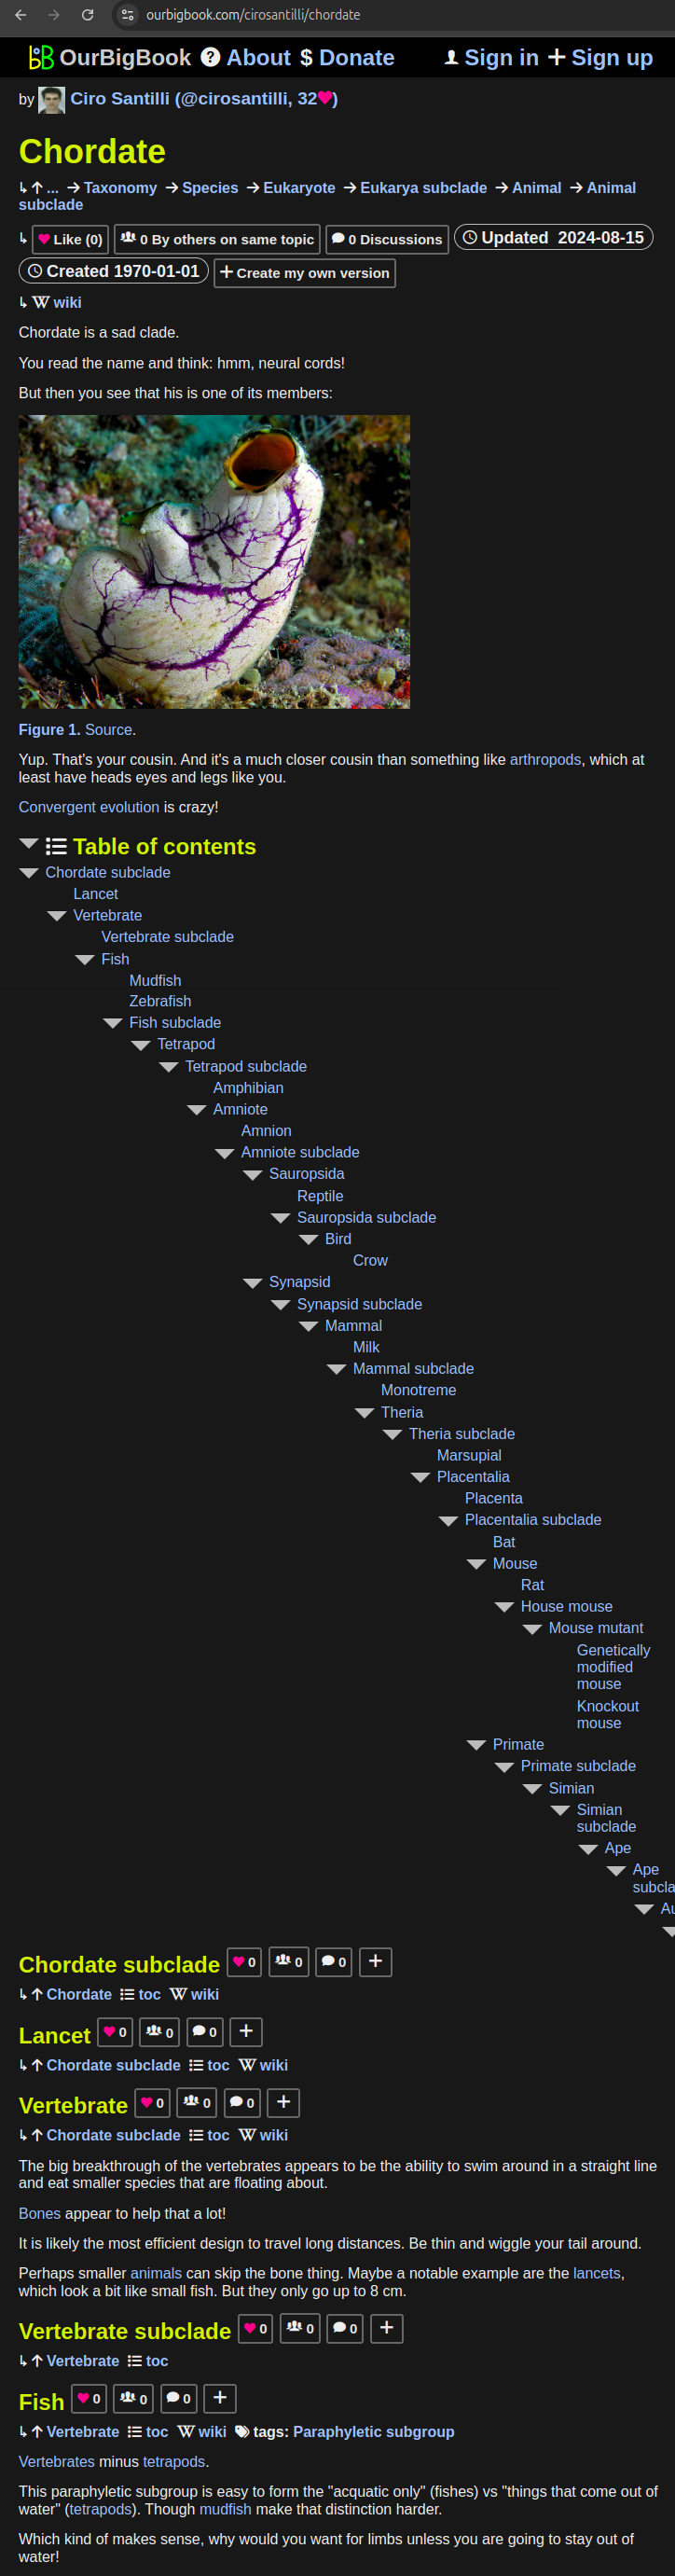
- Infinitely deep tables of contents:
All our software is open source and hosted at: github.com/ourbigbook/ourbigbook
Further documentation can be found at: docs.ourbigbook.com
Feel free to reach our to us for any help or suggestions: docs.ourbigbook.com/#contact