Topics (203k) Articles (205k) Users (298) Discussions (237) Comments (383) Files (715) New article

DTED stands for Digital Terrain Elevation Data. It is a format used for representing terrain elevation data, typically in a raster format, which consists of elevations above a defined reference level (usually sea level) at specific locations. DTED is primarily used by military and civilian applications for tasks such as terrain analysis, simulation, mission planning, and geospatial analysis. The data is organized into a grid of elevation points, with each point representing the elevation of the terrain at that location.
D. R. Fraser Taylor is a prominent Canadian geographer and a recognized authority in the field of Geographic Information Systems (GIS), cartography, and digital mapping. He is known for his work in developing techniques and methodologies for spatial data analysis and visualization. Taylor has been involved in various academic and research endeavors, contributing to the understanding of geographical information science and its applications across different disciplines.
Cultural mapping is a process that involves documenting, analyzing, and visualizing the cultural resources, activities, and dynamics of a specific community or region. It provides a way to understand the cultural landscape by identifying the various elements that contribute to the identity and character of a place. These elements can include: 1. **Cultural Assets**: This encompasses historical sites, museums, art galleries, theaters, libraries, and other institutions that play a role in the cultural life of the community.
Critical cartography is an interdisciplinary approach that challenges traditional practices of map-making and the power dynamics inherent in cartographic representation. It examines how maps can both reflect and shape social, political, and cultural structures, often reinforcing dominant narratives while marginalizing alternative viewpoints. Key aspects of critical cartography include: 1. **Social Constructivism**: Recognizing that maps are not neutral representations of reality but are socially constructed artifacts that reflect the values, beliefs, and biases of their creators.
Counter-mapping refers to a participatory mapping process that challenges conventional power dynamics in the creation, representation, and use of geographic information. It is often employed by marginalized communities or groups to assert their rights, interests, and identities against dominant narratives and official maps created by authorities, governments, or corporations.
A contour line is a line on a map that connects points of equal elevation above a given level, such as sea level. Contour lines are used in topographic maps to represent the three-dimensional shape of the terrain on a two-dimensional surface. Each line indicates a constant elevation, and the spacing between contour lines reveals the steepness of the terrain: closely spaced lines indicate steep slopes, while lines that are far apart indicate gentle or flat areas.
A compass rose is a figure on a map or nautical chart that displays the orientation of the cardinal directions—north, east, south, and west—as well as intermediate directions (northeast, southeast, southwest, and northwest). It provides a visual reference to understand direction and navigation. Typically, the compass rose is depicted as a circular design, with the directions often labeled and the north point typically indicated by a prominent or stylized arrow.
The Coastline Paradox refers to the counterintuitive observation that the measured length of a coastline can vary significantly depending on the scale of the measurement tool used. This phenomenon arises from the fractal nature of coastlines and the complexity of their shapes.
Climate TRACE (Tracking Real-time Atmospheric Carbon Emissions) is an initiative aimed at providing accurate and timely data on greenhouse gas emissions globally. Founded in 2020, it leverages advanced technologies such as satellite imagery, machine learning, and artificial intelligence to monitor and analyze emissions from various sources, including power plants, factories, and transportation.
Chorography is a branch of geography that focuses on the description and mapping of particular regions or areas. It involves the study of the physical and cultural characteristics of specific places, emphasizing their spatial relationships, landforms, climate, vegetation, and human activities. Chorographers produce detailed accounts of landscapes, often combining cartography, environmental studies, and local history to provide a comprehensive view of a region.
Chart datum is a reference level used in nautical and hydrographic charts to measure water depths. It is an important concept in maritime navigation, as it provides a standard baseline from which depths and heights are measured. Chart datum is usually defined as a specific level of a tidal system, and it can be based on various criteria, such as mean sea level, lowest astronomical tide (LAT), or mean low water springs (MLWS).
In cartography, a cartouche is a decorative motif used to enclose a map's title, scale, legend, or other important information. It is often ornately designed, giving maps an artistic touch while also helping to highlight key textual information. The term "cartouche" originally comes from the French word for a scroll or a roll of paper, and it is sometimes associated with a frame that resembles an elongated oval or a shield shape.
Cartopology is a relatively new field that integrates concepts from cartography (the art and science of map-making) and topology (the mathematical study of spatial properties and relationships). While the term itself may not be widely recognized or established, the concept often revolves around understanding how spatial relationships and geographic data can be represented, manipulated, and analyzed in a way that emphasizes their inherent properties, regardless of their specific geometric forms.
Cartography of Latin America refers to the art and science of map-making specific to the countries and regions within Latin America. This encompasses a variety of maps that depict geographical, cultural, political, and economic features of Latin American countries. Key aspects of cartography in this context include: 1. **Geographical Features**: Maps that display physical geography, including mountains, rivers, forests, and climate zones.
Cartography and Geographic Information Science (GIScience) are closely related fields focused on the representation, analysis, and understanding of geographical information. ### Cartography Cartography is the art and science of creating maps. It involves the design, production, and use of maps to communicate spatial information effectively. Cartographers employ various techniques to convey data about geographical features, such as topography, population density, land use, and transportation networks.
Cartographic expeditions to Greenland refer to the series of mapping and exploration missions undertaken to chart the geography, topography, and resources of Greenland over the centuries. These expeditions have played a crucial role in understanding the island's landscape, climate, and indigenous cultures, as well as its potential for resource development. ### Historical Context 1.
Cartographic design refers to the art and science of creating maps, focusing on how to visually represent spatial information effectively and aesthetically. It involves a careful blend of art, geography, and communication to convey information through maps. Key aspects of cartographic design include: 1. **Purpose and Audience**: Understanding the objectives of the map and who will use it is crucial. Different audiences may require different levels of detail, types of information, and styles.
Cartographic censorship refers to the practice of altering, omitting, or distorting geographical information on maps to control the dissemination of knowledge, influence public perception, or achieve political or ideological objectives. This can take various forms, including: 1. **Omission of Features**: Certain geographical features, such as borders, landmarks, or entire territories, may be deliberately left out or misrepresented. For instance, some maps may exclude disputed regions or territories claimed by a country.
Cartifact is a company that specializes in creating custom maps and geographic data visualization solutions. They offer services that allow users to easily integrate maps into their web applications or print materials, enabling businesses and organizations to communicate geographical information more effectively. By using Cartifact, clients can tailor maps to their specific needs, whether for marketing, data analysis, or enhancing user engagement. Their offerings often include interactive features, various data overlays, and options for personalization to meet diverse mapping requirements.
A bird's-eye view refers to a perspective that depicts a scene from high above, as though one were looking down from the sky, akin to how a bird might see the landscape from its flight. This viewpoint provides a wide-angle overview that includes a larger context of the area, allowing for a more comprehensive understanding of the layout and relationships of various elements within the scene.
Pinned article: Introduction to the OurBigBook Project
Welcome to the OurBigBook Project! Our goal is to create the perfect publishing platform for STEM subjects, and get university-level students to write the best free STEM tutorials ever.
Everyone is welcome to create an account and play with the site: ourbigbook.com/go/register. We belive that students themselves can write amazing tutorials, but teachers are welcome too. You can write about anything you want, it doesn't have to be STEM or even educational. Silly test content is very welcome and you won't be penalized in any way. Just keep it legal!
Intro to OurBigBook
. Source. We have two killer features:
- topics: topics group articles by different users with the same title, e.g. here is the topic for the "Fundamental Theorem of Calculus" ourbigbook.com/go/topic/fundamental-theorem-of-calculusArticles of different users are sorted by upvote within each article page. This feature is a bit like:
- a Wikipedia where each user can have their own version of each article
- a Q&A website like Stack Overflow, where multiple people can give their views on a given topic, and the best ones are sorted by upvote. Except you don't need to wait for someone to ask first, and any topic goes, no matter how narrow or broad
This feature makes it possible for readers to find better explanations of any topic created by other writers. And it allows writers to create an explanation in a place that readers might actually find it.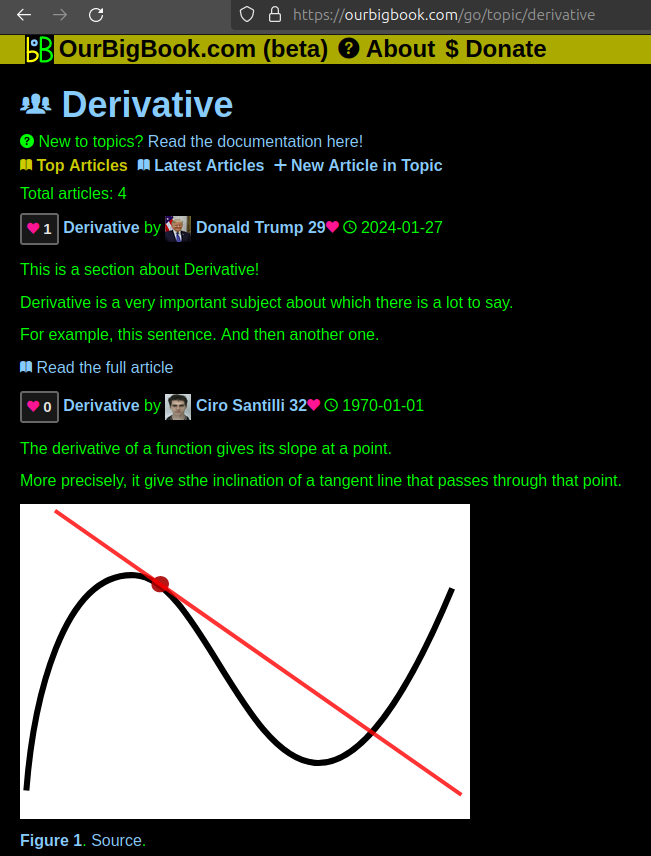
Figure 1. Screenshot of the "Derivative" topic page. View it live at: ourbigbook.com/go/topic/derivativeVideo 2. OurBigBook Web topics demo. Source. - local editing: you can store all your personal knowledge base content locally in a plaintext markup format that can be edited locally and published either:This way you can be sure that even if OurBigBook.com were to go down one day (which we have no plans to do as it is quite cheap to host!), your content will still be perfectly readable as a static site.
- to OurBigBook.com to get awesome multi-user features like topics and likes
- as HTML files to a static website, which you can host yourself for free on many external providers like GitHub Pages, and remain in full control
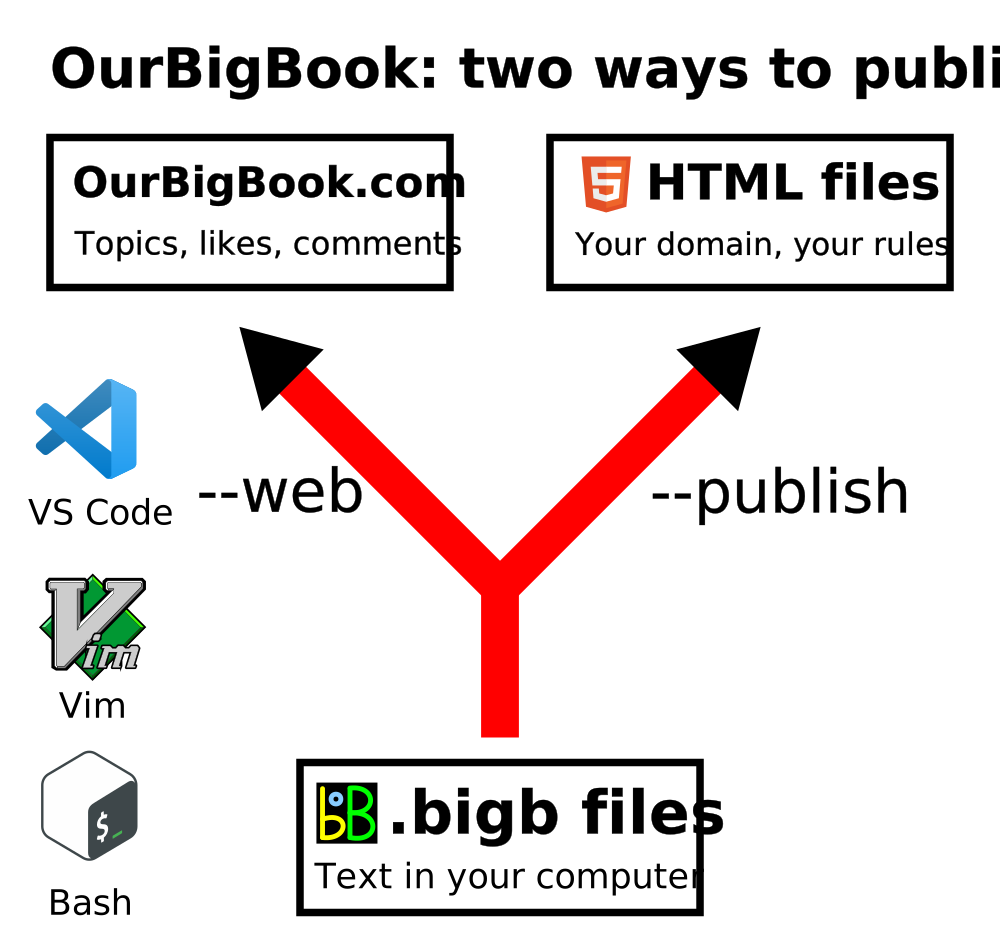
Figure 2. You can publish local OurBigBook lightweight markup files to either OurBigBook.com or as a static website.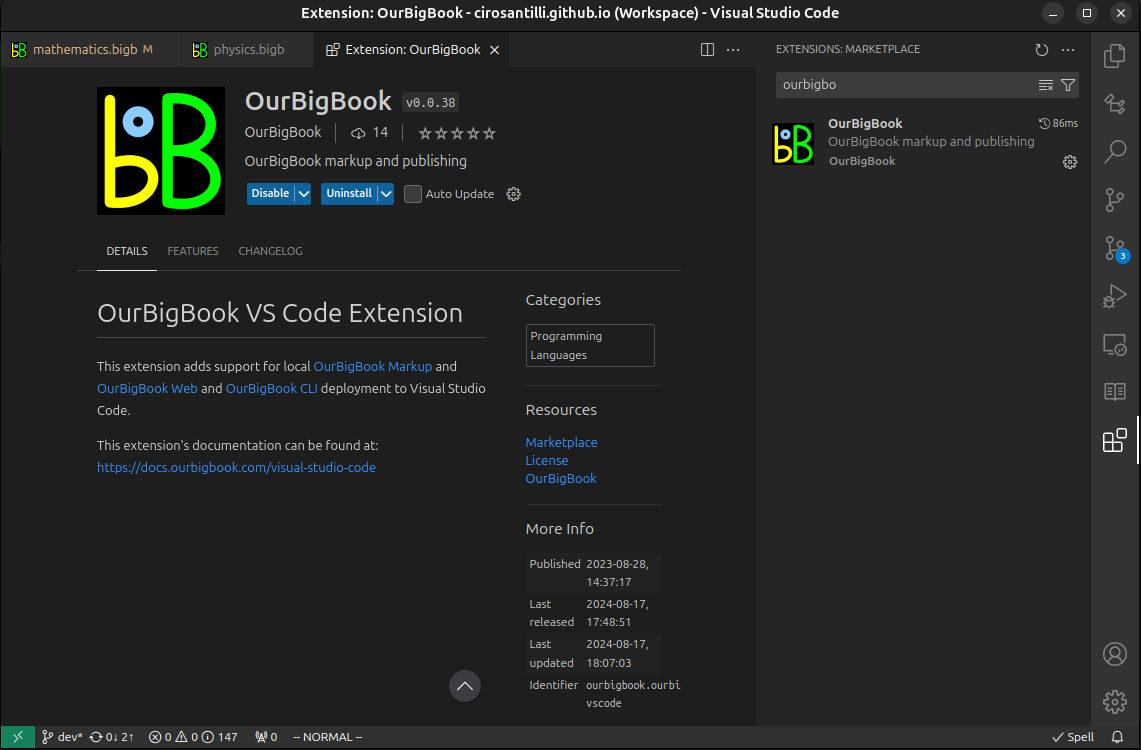
Figure 3. Visual Studio Code extension installation.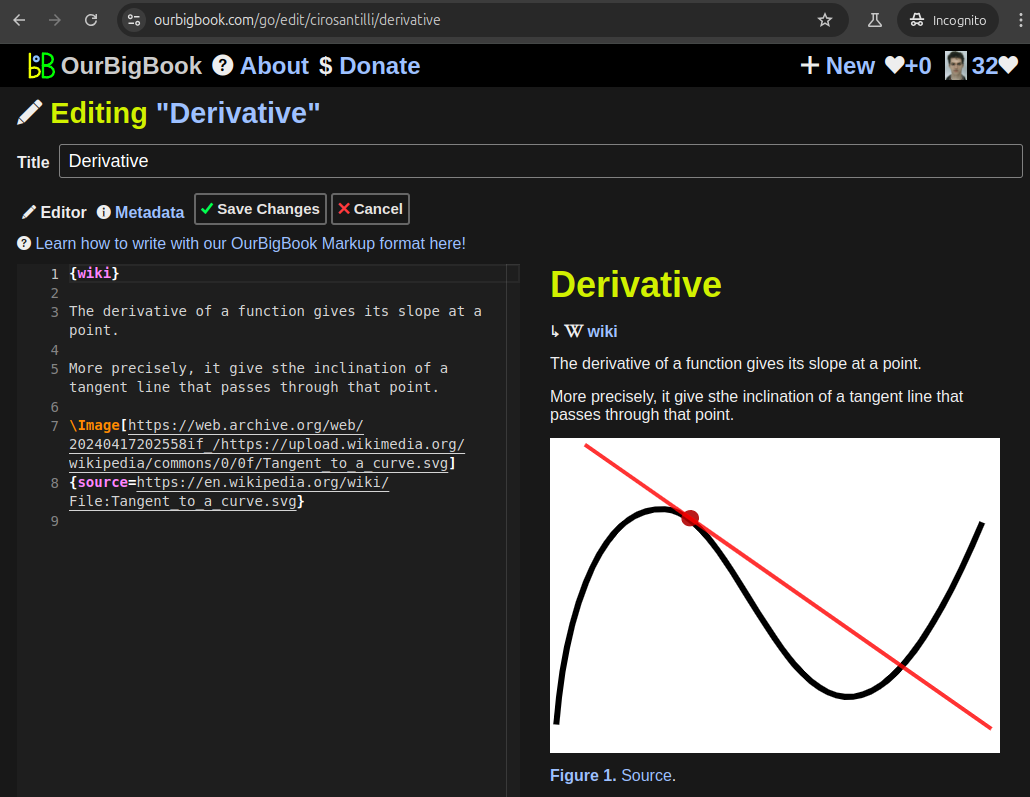
Figure 5. . You can also edit articles on the Web editor without installing anything locally. Video 3. Edit locally and publish demo. Source. This shows editing OurBigBook Markup and publishing it using the Visual Studio Code extension. 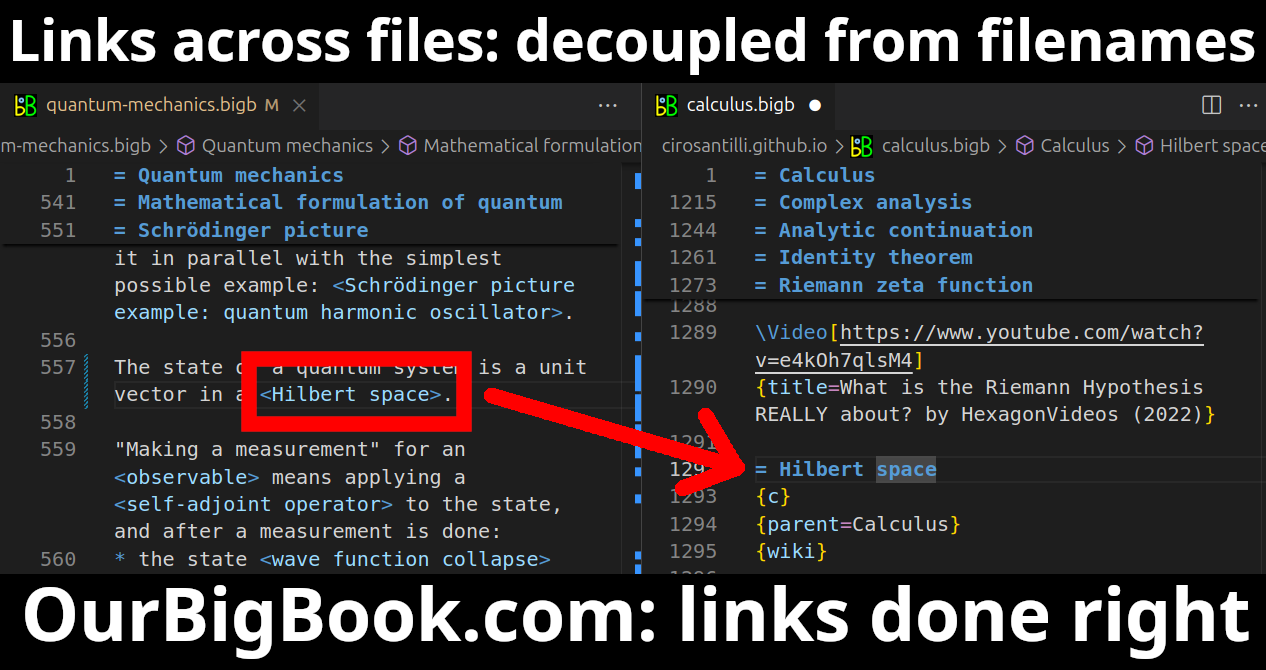
- Infinitely deep tables of contents:
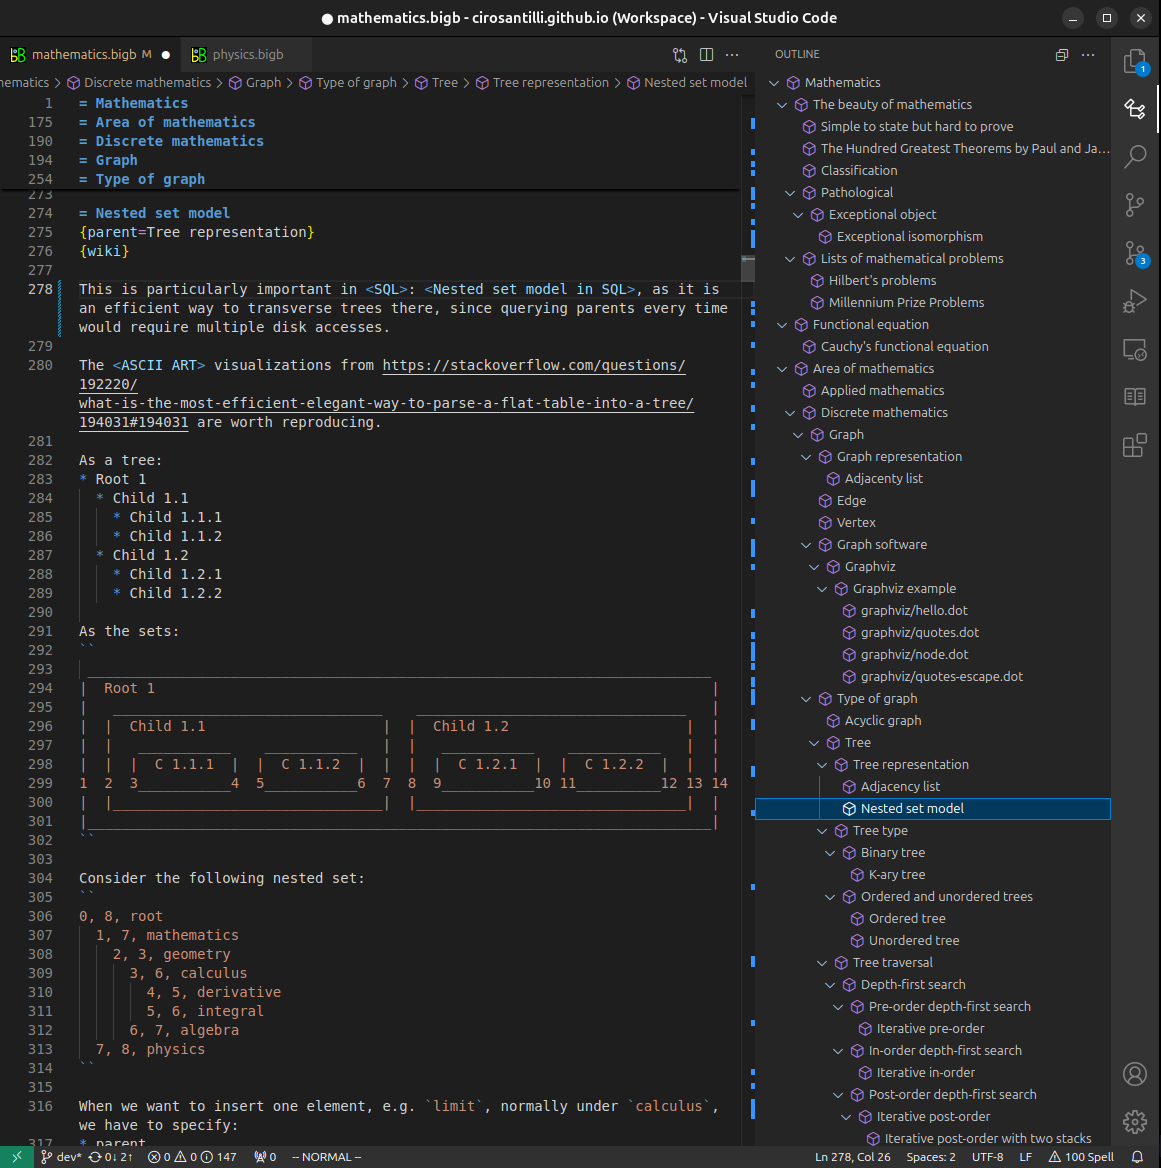
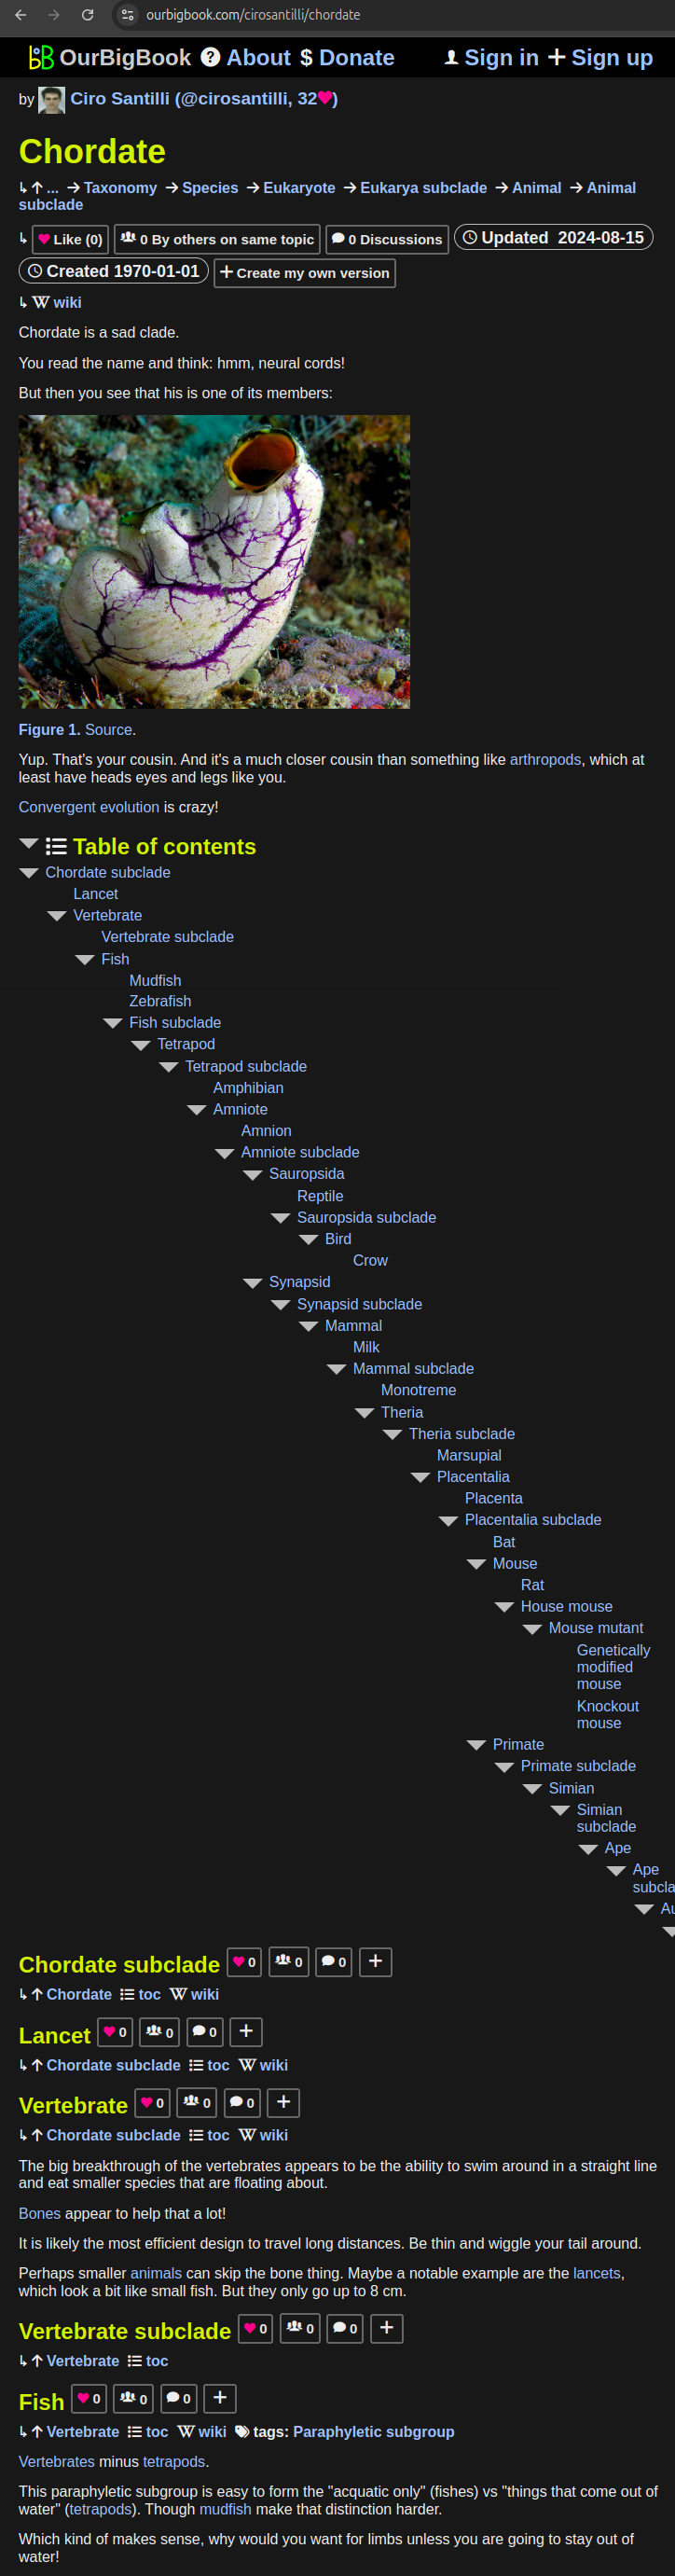
All our software is open source and hosted at: github.com/ourbigbook/ourbigbook
Further documentation can be found at: docs.ourbigbook.com
Feel free to reach our to us for any help or suggestions: docs.ourbigbook.com/#contact