Topics (203k) Articles (205k) Users (298) Discussions (237) Comments (383) Files (715) New article

In geography, a "quadrangle" refers to a specific area of land that is defined by a set of boundaries, typically in the shape of a rectangle or square. The term is often used in the context of topographical maps, where a quadrangle represents a specific section of land that is mapped in detail. In the United States, quadrangles are commonly associated with topographic maps produced by the U.S.
The Qinling–Huaihe Line is an important geographical and climatic dividing line in China. It stretches approximately from the Qinling Mountains in the west to the Huaihe River in the east. This line is significant because it separates the northern and southern parts of China, which have distinct climate, culture, and economic characteristics.
Planimetrics refers to the representation of two-dimensional spatial data, typically focusing on the horizontal layout of features and landforms on a plane. It involves the use of maps and diagrams to portray the location and arrangement of various physical features, such as buildings, roads, vegetation, and bodies of water, without considering elevation or height.
Planetary cartography is the science and art of mapping celestial bodies, such as planets, moons, asteroids, and other objects in our solar system and beyond. It involves creating detailed representations of these bodies' surfaces, topography, geology, and other characteristics. Key aspects of planetary cartography include: 1. **Data Collection**: Data for planetary maps is typically gathered from various sources, including space missions, telescopic observations, and remote sensing technologies.
"Places & Spaces: Mapping Science" is a collaborative project that aims to visualize the landscape of scientific research through innovative mapping techniques. This initiative is often associated with the work of researchers like Katy Börner, a prominent figure in the field of information visualization and science mapping. The project includes the creation of visualizations that map various aspects of scientific literature, including citation patterns, research topics, and the evolution of scientific fields over time.
In cartography, a "phase line" typically refers to a specific type of line used to denote a boundary or a transition in a phased situation, often in military maps. Phase lines can indicate the advancement of troops or the boundary of different operational phases in military campaigns. They help in coordinating movement, determining objectives, and establishing communication among different units.
Phantom settlement generally refers to a situation in finance or legal contexts where a transaction appears to have occurred, but no actual change in ownership or value has taken place. This term can be used in a few different ways, depending on the context. 1. **Finance and Accounting**: In finance, a phantom settlement might refer to accounting entries that reflect transactions for reporting purposes but do not result in physical transfer of assets or cash.
"Paper Street" is a term that generally refers to a street or road that appears on maps or official documents but does not actually exist in the physical world. The term can be used in various contexts, such as urban planning or real estate, where streets are planned but never constructed. Additionally, "Paper Street" gained cultural recognition through its portrayal in the novel and film "Fight Club," where it refers to a fictional street associated with the underground organization led by the protagonist.
The outline of cartography typically encompasses the study, creation, and communication of maps. Here’s a structured outline that can give you a comprehensive overview of the field: ### I. Introduction to Cartography A. Definition of Cartography B. Importance and Applications of Cartography C. Historical Development of Cartography ### II. Fundamental Concepts in Cartography A. Maps and Their Types 1. Topographic Maps 2.
An orthophoto, or orthophotograph, is aerial photography that has been geometrically corrected (orthorectified) to ensure that the scale of the photograph is uniform across the image. This means that an orthophoto can be measured directly for distances, areas, and other spatial measurements as if it were a map, making it a key tool in various fields like cartography, land-use planning, and geographic information systems (GIS).
The Ordnance Survey Great Britain County Series refers to a collection of detailed historical maps produced by the Ordnance Survey, the national mapping agency for Great Britain. These maps were created primarily during the late 19th century and early 20th century, specifically from the 1850s up to the 1940s.
An opisometer is a measuring instrument used to measure lengths or distances along curved paths. It typically consists of a wheel that rolls along the surface of the curve, and the distance is read off a scale or display. Opisometers are often used in fields such as cartography, engineering, and surveying to measure irregular or curved lines, such as those found on maps or in diagrams. They can be mechanical or digital, with the latter providing more precise readings.
Natural Earth is not a projection itself; rather, it refers to a set of public domain map datasets that are designed for cartographic use, typically at a scale suitable for visualizing geographic features on a world map. The datasets include vector and raster data representing physical and cultural features of the Earth, such as landforms, water bodies, roads, cities, and more.
Natural Earth is a public domain map dataset that provides high-quality, vector and raster map data for both natural and cultural geographic features. It is designed for use in geographic information systems (GIS), cartography, and various forms of spatial analysis. The data sets include information such as: - Physical features: mountains, rivers, lakes, and terrain. - Cultural features: political boundaries, cities, roads, and populated places.
The National Elevation Dataset (NED) is a collection of elevation data created and maintained by the U.S. Geological Survey (USGS). It provides a high-resolution, consistent, and seamless representation of the Earth's surface elevation across the United States. The NED is built from various data sources, including satellite imagery, lidar, and traditional topographic maps, and it is available in multiple formats and resolutions to meet different user needs.
Multimedia cartography is an interdisciplinary field that combines traditional cartography with multimedia technologies to create dynamic, interactive, and engaging map representations. It involves the use of various media forms—such as text, images, audio, video, and animations—to enhance the communication of geographic information and to provide users with a richer, more immersive experience when interacting with spatial data.
A Minimum Bounding Rectangle (MBR), also known as the bounding box, is the smallest rectangle that can completely enclose a geometric shape or a set of points in a coordinate space. It is commonly used in various fields such as computer graphics, geographical information systems (GIS), and computational geometry. ### Characteristics of an MBR: 1. **Axis-Aligned**: An MBR is typically defined in an axis-aligned manner, meaning its edges are parallel to the coordinate axes (e.g.
The Maximum Elevation Figure (MEF) is a term used in aviation to refer to the highest elevation, in feet or meters, of terrain, obstacles, or other features in a particular area, taking into account a specified vertical clearance. This figure is typically used in aviation charts, especially in the context of en route navigation and obstacle clearance. The MEF is important for pilots to ensure safe flight operations by providing information about the tallest structures and terrain in the vicinity.
The map-territory relation is a philosophical concept that highlights the differences between an abstract representation (the map) and the actual object or reality it represents (the territory). The idea emphasizes that a map is not the same as the territory it depicts; rather, it is a simplification or model that can help us understand or navigate the territory.
The term "map symbol" refers to graphical representations or signs used on a map to convey information about various features and characteristics of the geographic area being depicted. Map symbols can represent a wide range of information, including: 1. **Landmarks**: Symbols indicating important buildings, monuments, or locations (e.g., schools, hospitals, airports). 2. **Physical Features**: Symbols that indicate natural features such as rivers, mountains, lakes, and forests.
Pinned article: Introduction to the OurBigBook Project
Welcome to the OurBigBook Project! Our goal is to create the perfect publishing platform for STEM subjects, and get university-level students to write the best free STEM tutorials ever.
Everyone is welcome to create an account and play with the site: ourbigbook.com/go/register. We belive that students themselves can write amazing tutorials, but teachers are welcome too. You can write about anything you want, it doesn't have to be STEM or even educational. Silly test content is very welcome and you won't be penalized in any way. Just keep it legal!
Intro to OurBigBook
. Source. We have two killer features:
- topics: topics group articles by different users with the same title, e.g. here is the topic for the "Fundamental Theorem of Calculus" ourbigbook.com/go/topic/fundamental-theorem-of-calculusArticles of different users are sorted by upvote within each article page. This feature is a bit like:
- a Wikipedia where each user can have their own version of each article
- a Q&A website like Stack Overflow, where multiple people can give their views on a given topic, and the best ones are sorted by upvote. Except you don't need to wait for someone to ask first, and any topic goes, no matter how narrow or broad
This feature makes it possible for readers to find better explanations of any topic created by other writers. And it allows writers to create an explanation in a place that readers might actually find it.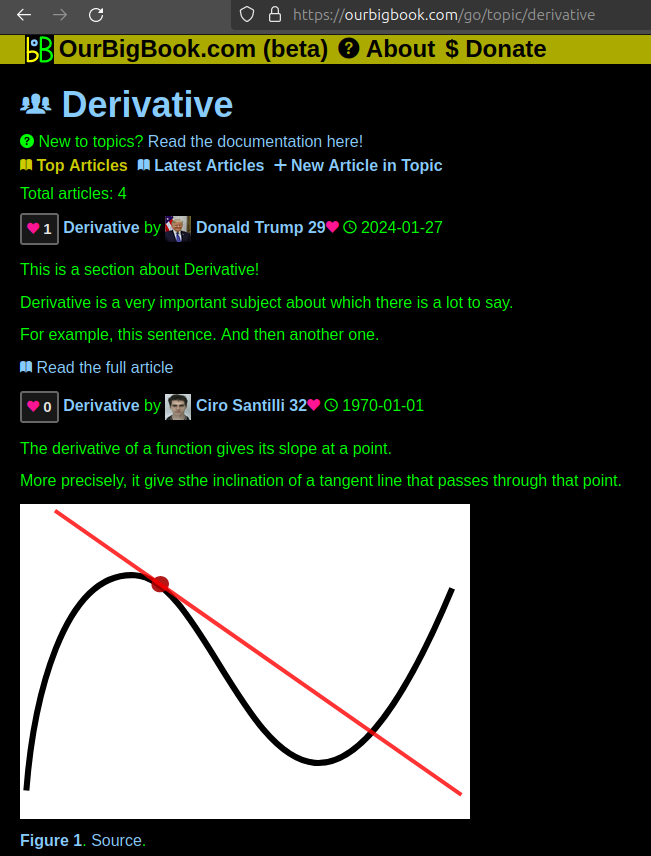
Figure 1. Screenshot of the "Derivative" topic page. View it live at: ourbigbook.com/go/topic/derivativeVideo 2. OurBigBook Web topics demo. Source. - local editing: you can store all your personal knowledge base content locally in a plaintext markup format that can be edited locally and published either:This way you can be sure that even if OurBigBook.com were to go down one day (which we have no plans to do as it is quite cheap to host!), your content will still be perfectly readable as a static site.
- to OurBigBook.com to get awesome multi-user features like topics and likes
- as HTML files to a static website, which you can host yourself for free on many external providers like GitHub Pages, and remain in full control
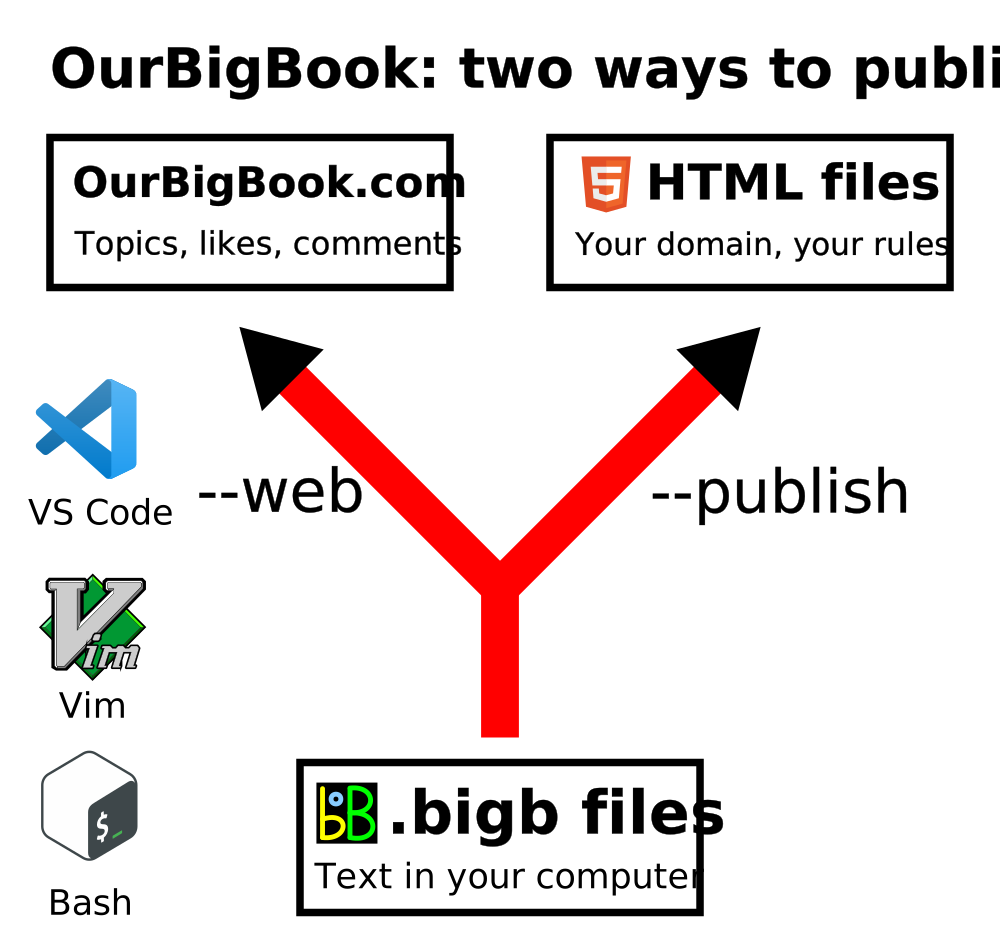
Figure 2. You can publish local OurBigBook lightweight markup files to either OurBigBook.com or as a static website.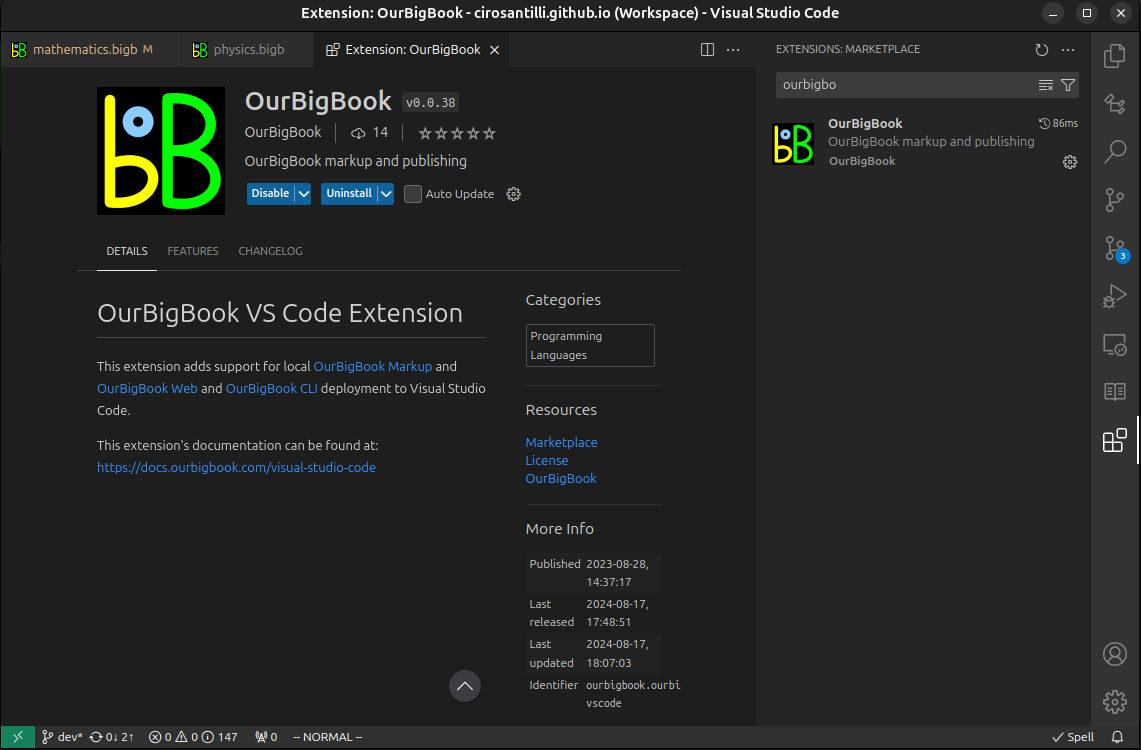
Figure 3. Visual Studio Code extension installation.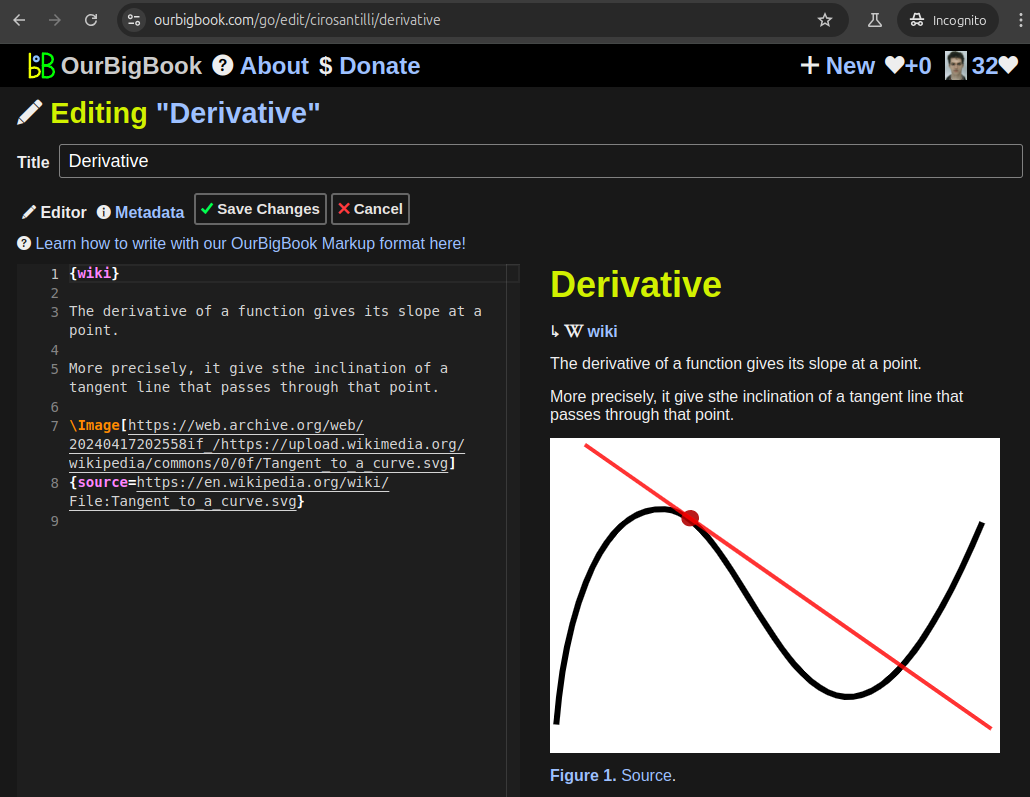
Figure 5. . You can also edit articles on the Web editor without installing anything locally. Video 3. Edit locally and publish demo. Source. This shows editing OurBigBook Markup and publishing it using the Visual Studio Code extension. 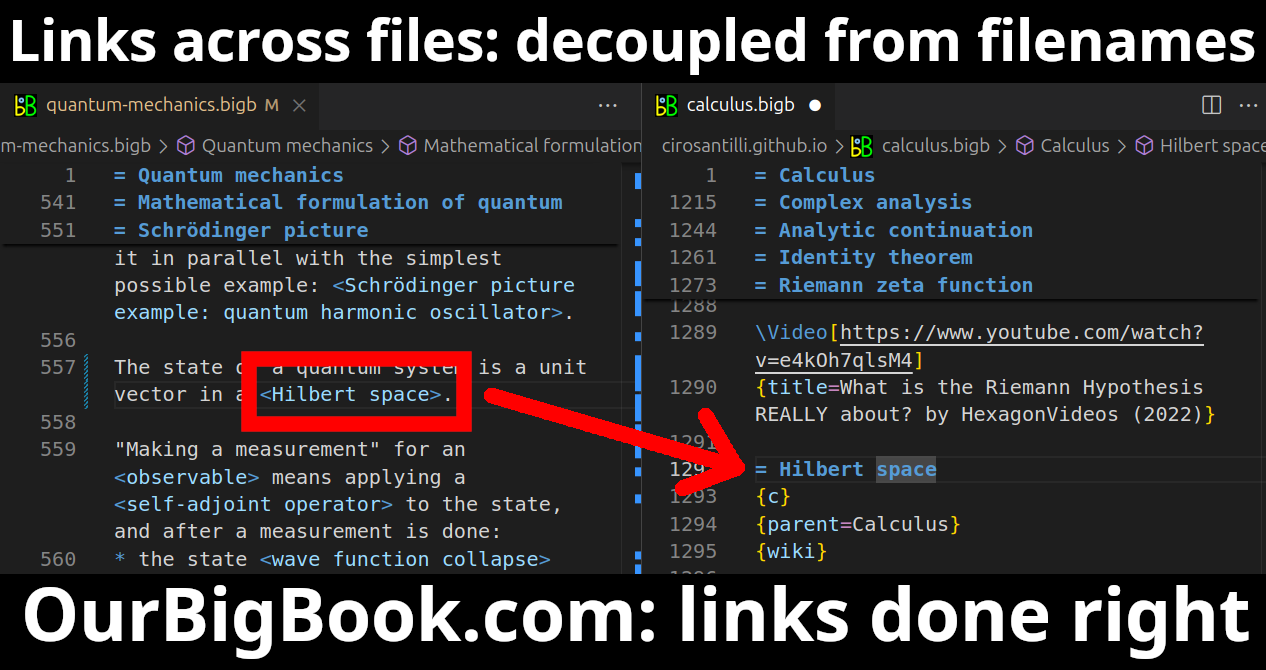
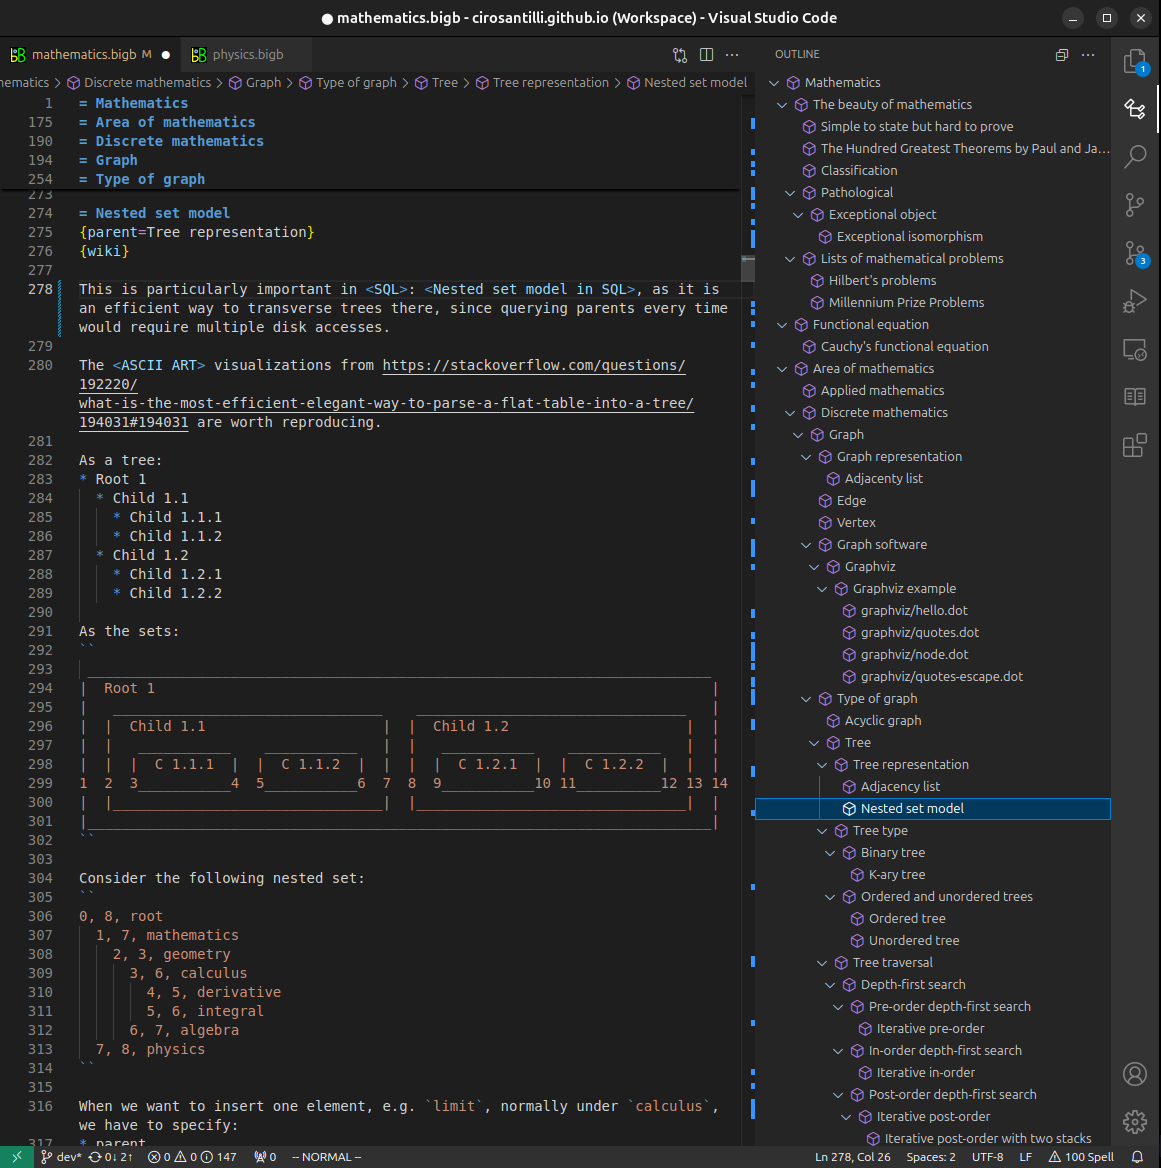
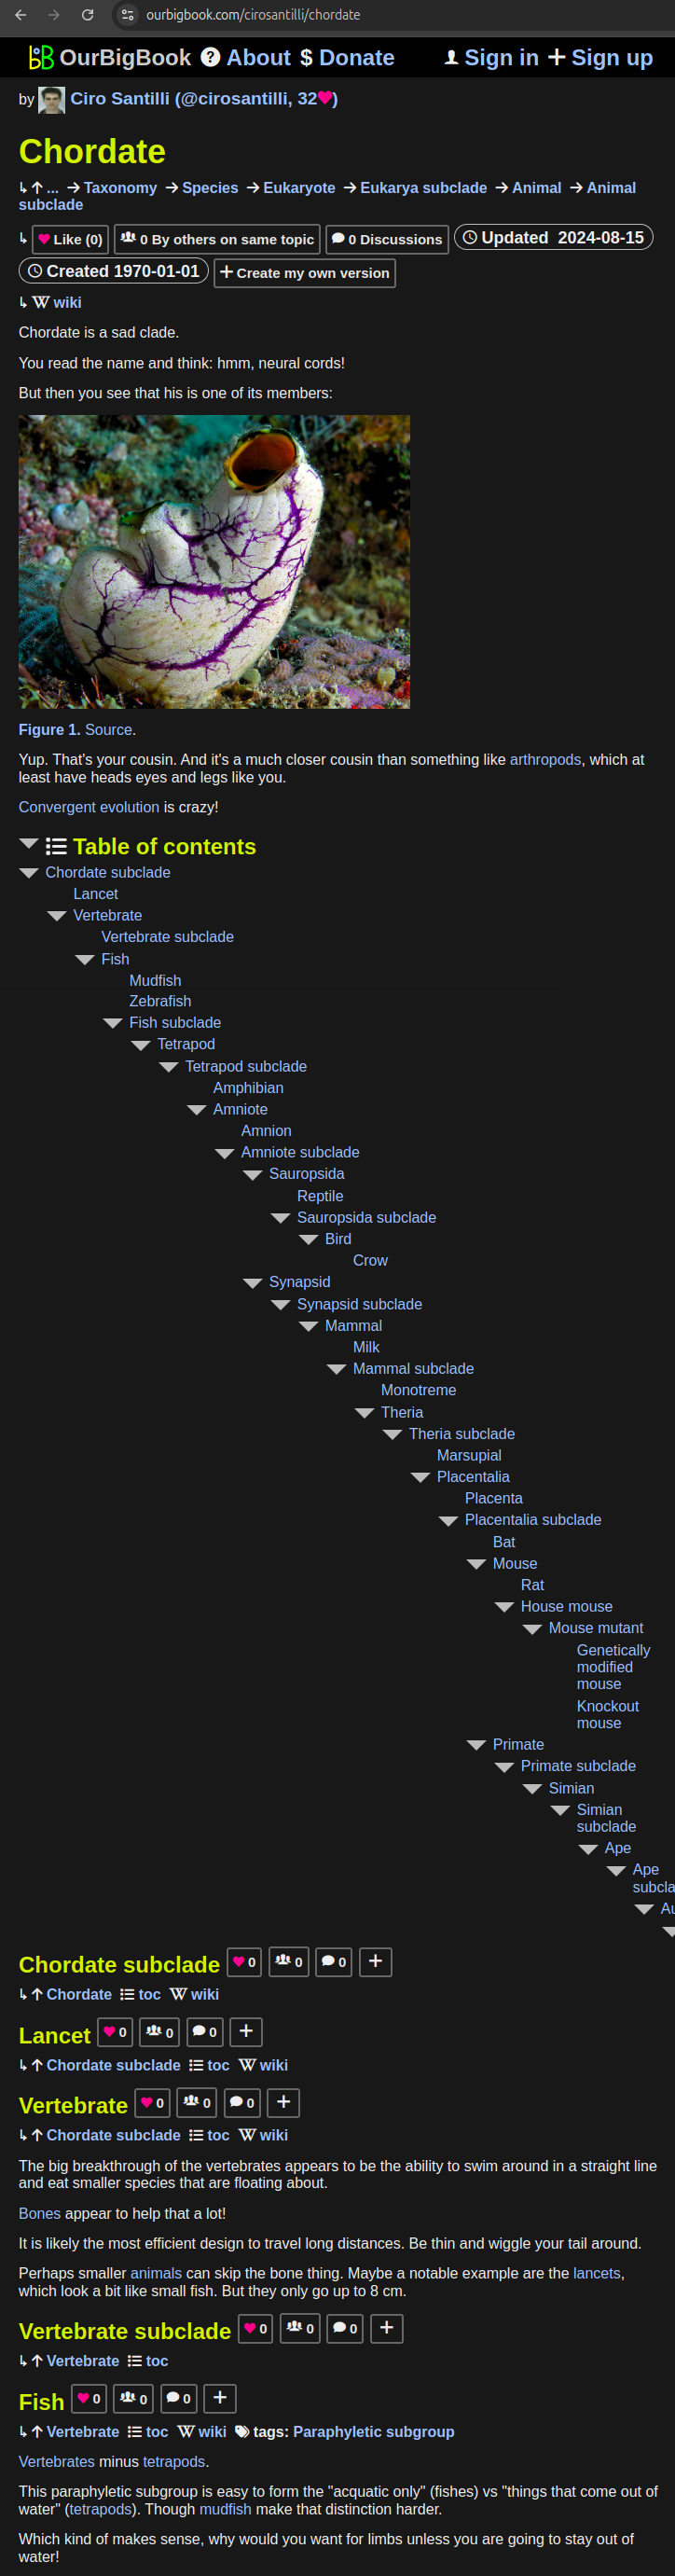
- Infinitely deep tables of contents:
All our software is open source and hosted at: github.com/ourbigbook/ourbigbook
Further documentation can be found at: docs.ourbigbook.com
Feel free to reach our to us for any help or suggestions: docs.ourbigbook.com/#contact