Under: gmp.
The original gangster.
It also has serious applications obviously. www.sympy.org/scipy-2017-codegen-tutorial/ mentions code generation capabilities, which sounds super cool!
Let's start with some basics. fractions:outputs:Note that this is an exact value, it does not get converted to floating-point numbers where precision could be lost!
from sympy import *
sympify(2)/3 + sympify(1)/27/6We can also do everything with symbols:outputs:We can now evaluate that expression object at any time:outputs:
from sympy import *
x, y = symbols('x y')
expr = x/3 + y/2
print(expr)x/3 + y/2expr.subs({x: 1, y: 2})4/3How about a square root?outputs:so we understand that the value was kept without simplification. And of course:outputs outputs:gives:
x = sqrt(2)
print(x)sqrt(2)sqrt(2)**22. Also:sqrt(-1)II is the imaginary unit. We can use that symbol directly as well, e.g.:I*I-1Let's do some trigonometry:gives:and:gives:The exponential also works:gives;
cos(pi)-1cos(pi/4)sqrt(2)/2exp(I*pi)-1Now for some calculus. To find the derivative of the natural logarithm:outputs:Just read that. One over x. Beauty. And now for some integration:outputs:OK.
from sympy import *
x = symbols('x')
print(diff(ln(x), x))1/xprint(integrate(1/x, x))log(x)Let's do some more. Let's solve a simple differential equation:Doing:outputs:which means:To be fair though, it can't do anything crazy, it likely just goes over known patterns that it has solvers for, e.g. if we change it to:it just blows up:Sad.
y''(t) - 2y'(t) + y(t) = sin(t)from sympy import *
x = symbols('x')
f, g = symbols('f g', cls=Function)
diffeq = Eq(f(x).diff(x, x) - 2*f(x).diff(x) + f(x), sin(x)**4)
print(dsolve(diffeq, f(x)))Eq(f(x), (C1 + C2*x)*exp(x) + cos(x)/2)diffeq = Eq(f(x).diff(x, x)**2 + f(x), 0)NotImplementedError: solve: Cannot solve f(x) + Derivative(f(x), (x, 2))**2Let's try some polynomial equations:which outputs:which is a not amazingly nice version of the quadratic formula. Let's evaluate with some specific constants after the fact:which outputsLet's see if it handles the quartic equation:Something comes out. It takes up the entire terminal. Naughty. And now let's try to mess with it:and this time it spits out something more magic:Oh well.
from sympy import *
x, a, b, c = symbols('x a b c d e f')
eq = Eq(a*x**2 + b*x + c, 0)
sol = solveset(eq, x)
print(sol)FiniteSet(-b/(2*a) - sqrt(-4*a*c + b**2)/(2*a), -b/(2*a) + sqrt(-4*a*c + b**2)/(2*a))sol.subs({a: 1, b: 2, c: 3})FiniteSet(-1 + sqrt(2)*I, -1 - sqrt(2)*I)x, a, b, c, d, e, f = symbols('x a b c d e f')
eq = Eq(e*x**4 + d*x**3 + c*x**2 + b*x + a, 0)
solveset(eq, x)x, a, b, c, d, e, f = symbols('x a b c d e f')
eq = Eq(f*x**5 + e*x**4 + d*x**3 + c*x**2 + b*x + a, 0)
solveset(eq, x)ConditionSet(x, Eq(a + b*x + c*x**2 + d*x**3 + e*x**4 + f*x**5, 0), Complexes)Let's try some linear algebra.Let's invert it:outputs:
m = Matrix([[1, 2], [3, 4]])m**-1Matrix([
[ -2, 1],
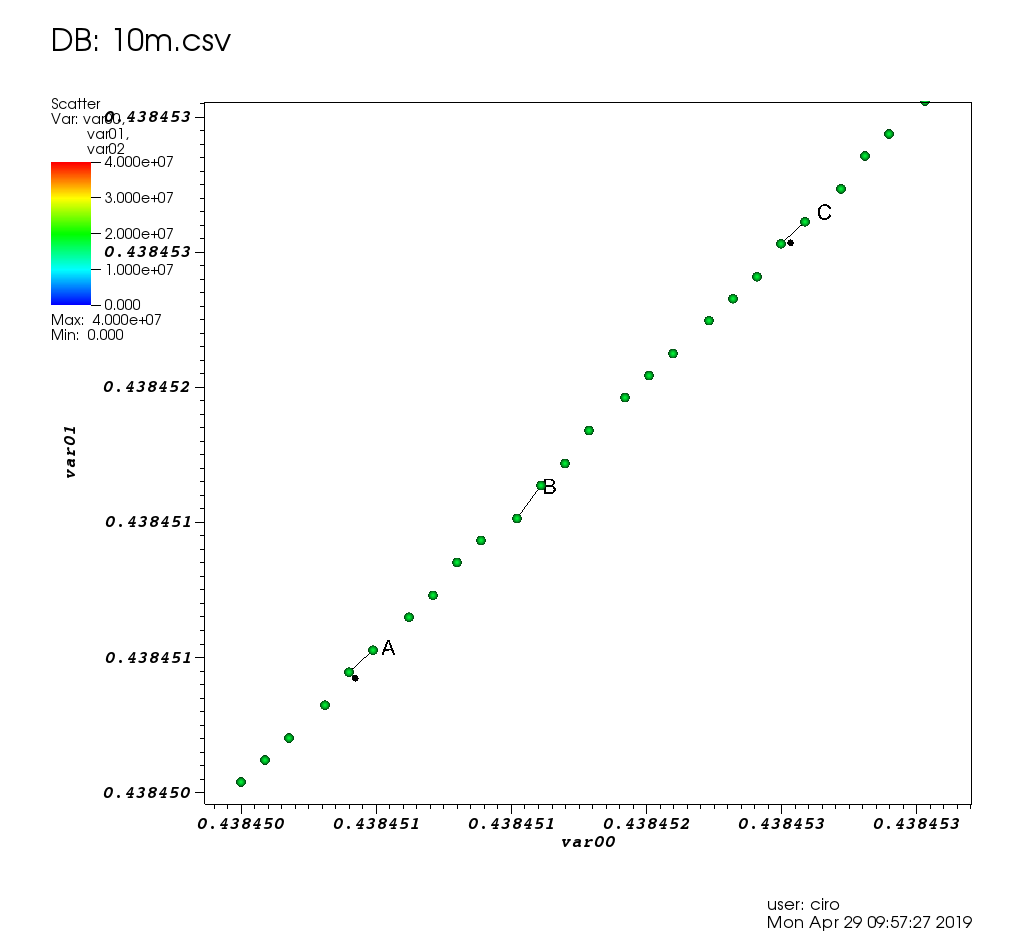
[3/2, -1/2]])Ciro's large dataset survey: Section "Survey of open source interactive plotting software with a 10 million point scatter plot benchmark by Ciro Santilli".
E.g. showing live data from a scientific instrument! TODO:
- superuser.com/questions/825588/what-is-the-easiest-way-of-visualizing-data-from-stdout-as-a-graph
- unix.stackexchange.com/questions/190337/how-can-i-make-a-graphical-plot-of-a-sequence-of-numbers-from-the-standard-input
- stackoverflow.com/questions/44470965/how-can-you-watch-gnuplot-realtime-data-plots-as-a-live-graph-with-automatic-up
- stackoverflow.com/questions/14074790/plotting-a-string-of-csv-data-in-realtime-using-linux
- stackoverflow.com/questions/11874767/how-do-i-plot-in-real-time-in-a-while-loop-using-matplotlib
By Ciro Santilli.
Tends to be Ciro's pick if gnuplot can't handle the use case, or if the project is really really serious.
Couldn't handle exploration of large datasets though: Survey of open source interactive plotting software with a 10 million point scatter plot benchmark by Ciro Santilli
Examples:
- matplotlib/hello.py
- matplotlib/educational2d.py
- matplotlib/axis.py
- matplotlib/label.py
- Line style
- Subplots
- matplotlib/two_lines.py
- Data from files
- Specialized
Tends to be Ciro Santilli's first attempt for quick and dirty graphing: github.com/cirosantilli/gnuplot-cheat.
When it doesn't, you Google for an hours, and then you give up in frustration, and fall back to Matplotlib.
Couldn't handle exploration of large datasets though: Survey of open source interactive plotting software with a 10 million point scatter plot benchmark by Ciro Santilli
CLI hello world:
gnuplot -p -e 'p sin(x)' Articles by others on the same topic
There are currently no matching articles.