An instrument-response limit in sequential population inference is a practical limit on identifying fast transfer or decay rates from a temporally broadened measurement. It depends on the instrument response function, photon statistics, timing calibration and the assumed kinetic model. The response width is not a universal hard cutoff below which every rate becomes unknowable.
For an original sequential model, take normalized lower-state photon-arrival densitywith , , and zero density before excitation. It corresponds to two successive independent exponential waiting times. A normalized instrument response produces modeled signalwith total signal scale and background . The measured curve is a convolution, not the molecular population curve alone. As grows with fixed, approaches : the fast-step signature becomes concentrated near the onset.
The arrival-time mean and variance areFor a zero-mean response of variance , independent timing broadening adds that variance. With lower-state lifetime 100 ps, transfer times 2 and 10 ps give intrinsic means 102 and 110 ps. A response standard deviation of 25 ps broadens both traces and makes their rapid onsets less distinct. An uncertain time-zero shift can further mimic part of the mean difference.
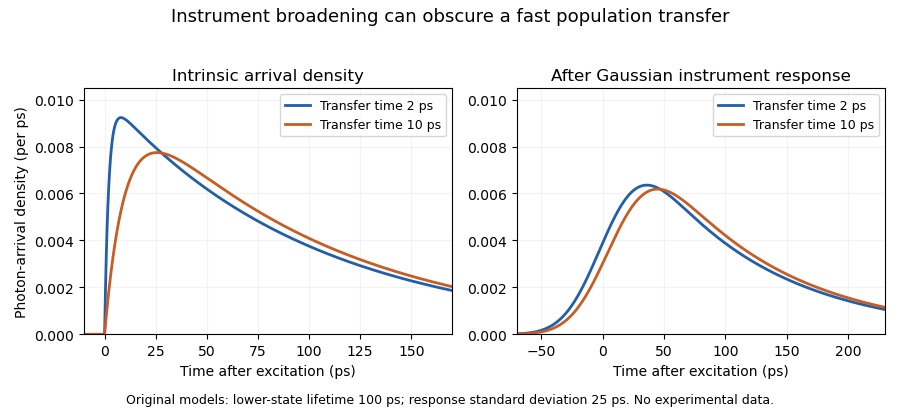
Original sequential-arrival models before and after Gaussian instrument broadening; the response obscures but does not erase every difference
. Details. 
A primary manufacturer technical note describes measuring an instrument response using a scattering sample and fitting by iterative reconvolution. It also explains why favorable photon counts can permit recovery of lifetimes shorter than the response width.[ref]
Time-Correlated Single Photon Counting (technical note v. 2.1) by Michael Wahl. printed p. 3, instrument response, reconvolution and measurement resolution
Thus an unresolved-looking rise can support a model-dependent bound rather than a precise, independently identified transfer rate.A useful experiment records the response under matching optical conditions, checks timing offsets and background, and compares response-convolved predictions across spectral channels. Confidence intervals or sensitivity to nuisance parameters reveal what the data actually constrain. A fine histogram bin width alone does not create temporal information absent from the measurement.
Articles by others on the same topic
There are currently no matching articles.