Nested measurements are responses grouped inside larger units, with each measured object belonging to just one such unit. Three leaves within each pot give nested measurements; repeatedly reading one leaf gives another level of repetition. Either can yield clustered data. A common random effect can describe the shared influence of the containing experimental unit.
For the constructed pot example, label treatments by , pots within each group by , and leaves within each pot by . Consider the statistical modelHere is a leaf length, is its group expected value, is a pot random effect, and describes remaining variation among leaves and measurement error. Assume that all pot random effects are mutually independent, all remaining errors are mutually independent, and the two collections are independent of one another and of the randomization. These are explicit modelling assumptions, conditional on the assigned treatments; no normal distribution assumption is needed for the following variance calculation.
Two distinct leaf measurements in one pot share . Their covariance is , their individual variance is , and their intraclass correlation coefficient isMeasurements from different pots have zero covariance and are independent under the stated statistical model. Statistical independence therefore concerns the whole response structure, not just the fact that the measured leaves are different objects.
For pots per treatment and leaves per pot, the group sample mean decomposes into two averages:The variance of a sum adds the variances of the independent terms. Every pot random effect has weight , whereas each remaining error has weight , giving the short proofThis is also the variance of the arithmetic mean of the pot sample means, each with variance . Equal numbers of leaves per pot make the two averaging procedures identical.
If all leaf measurements were falsely treated as independent, the predicted variance would instead be . The ratio of correct to false variance isThus pseudoreplication can underestimate a standard error by the square root of this ratio. Equality holds when or ; sharing a pot creates an error here precisely when the shared influence has positive variance.
Choose , , and as constructed model parameters in squared length units. These are assumptions rather than fitted experimental values. For each group,The treatment contrast has expected value . Since the group errors are independent conditional on the allocation, its variance is twice the group variance, namely , whereas the false calculation gives . Its correct standard error is length units; the false value is . The variance ratio is .
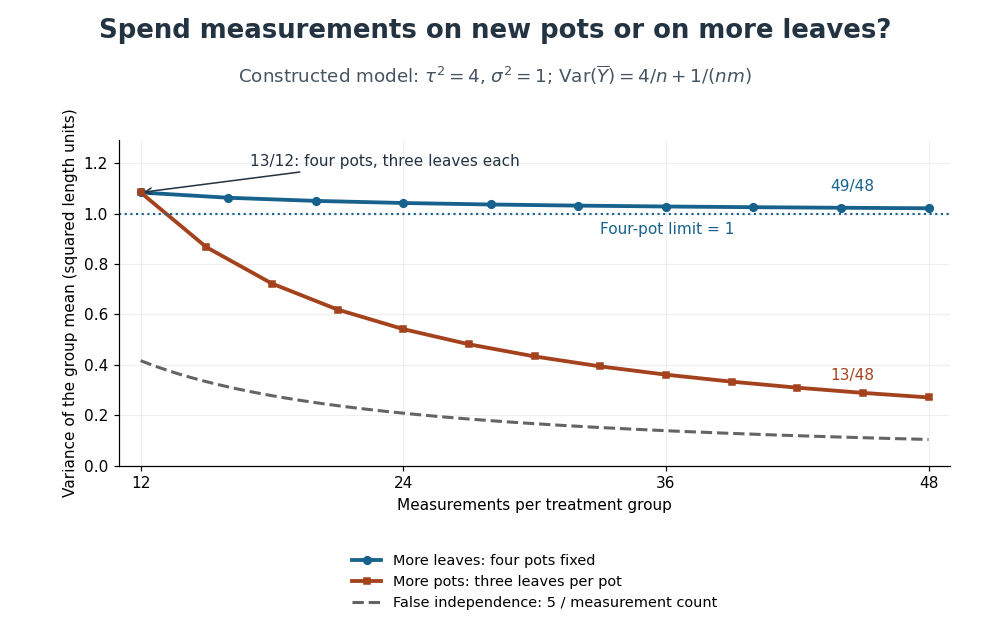
Constructed variance predictions: adding pots reduces uncertainty faster than adding leaf measurements within four pots
. Each curve uses and ; the horizontal axis counts measurements per treatment. The solid designs agree at four pots with three leaves each. The dashed curve assumes all measurements are independent and therefore illustrates pseudoreplication; none of the curves are observed experimental data. Details.
With four pots fixed, increasing drives the error contribution towards zero, but the limit of the group variance remains . Measuring twelve leaves on each of four pots gives . Using the same forty-eight measurements on sixteen pots, with three leaves per pot, gives . More independent experimental units reduce both contributions. Extra nested measurements are useful for characterizing each experimental unit, but cannot average away its shared random effect. This is why sample collection effort and the number of independent treatment replicates answer different questions.[ref]
Pseudoreplication and the Design of Ecological Field Experiments by Stuart H. Hurlbert. Pseudoreplication and the Design of Ecological Field Experiments, p. 201, “Multiple samples per experimental unit”
Articles by others on the same topic
There are currently no matching articles.