A Frenkel exciton is a tightly bound electron–hole excitation localized on approximately one molecular or ionic unit. Its radius is comparable to the lattice spacing, its exciton binding energy can be large, and transport is described through transfer of the local excitation between units. Molecular solids such as crystalline anthracene provide a natural example: the optical excitation is largely associated with an individual molecule, so a broad parabolic-band hydrogen model is not the most useful starting point.
A Wannier-Mott exciton extends over many unit cells. It is described approximately by a conduction electron and a valence hole with effective masses and a dielectric-screened Coulomb attraction. Its binding is usually smaller, and its levels resemble a hydrogenic series. gallium arsenide is a suitable example because its direct-gap band-edge carriers have light effective masses and substantial dielectric dielectric screening, supporting spatially extended excitons. Localization length and dielectric screening, rather than whether a material happens to be called a semiconductor, distinguish the two limiting pictures. Real materials can lie between the limits, so neither family is a universal sharp classification.
The sharp solid curve is the K spectrum; the broadened dashed curve is the K spectrum. At low temperature, a strong discrete exciton transition appears just below the continuum edge, with weaker higher members converging toward the band gap. Heating broadens those resonances through scattering, reduces their spectral resolution, and shifts the band edge to lower photon energy. The lower-energy broad dashed maximum is therefore not evidence for a second unrelated low-temperature band gap.
Read approximate energies from the native figure: the main low-temperature peak is near eV and a weaker feature is near – eV, with the continuum edge around eV. A three-dimensional hydrogenic series then givesFor example, predicts about meV, consistent with those feature spacings. These are graphical estimates at roughly meV precision, not extra digits extracted from the line widths. The strong direct interband onset and subgap series support a direct-gap Wannier-Mott interpretation. The continuum absorption scale is of order m, corresponding to an optical absorption length of order a micrometre. At K, meV is already comparable with the inferred binding scale, explaining why a sharp Rydberg series is poorly resolved; at K, meV.
With , the reduced mass is . In the screened hydrogen model,It follows thatA radius of several nanometres is consistent with an extended exciton in an ordinary semiconductor lattice. The relative permittivity inferred here is the effective dielectric screening parameter of that model; identifying the material chemically or determining a full dielectric spectrum is not possible from these data alone.
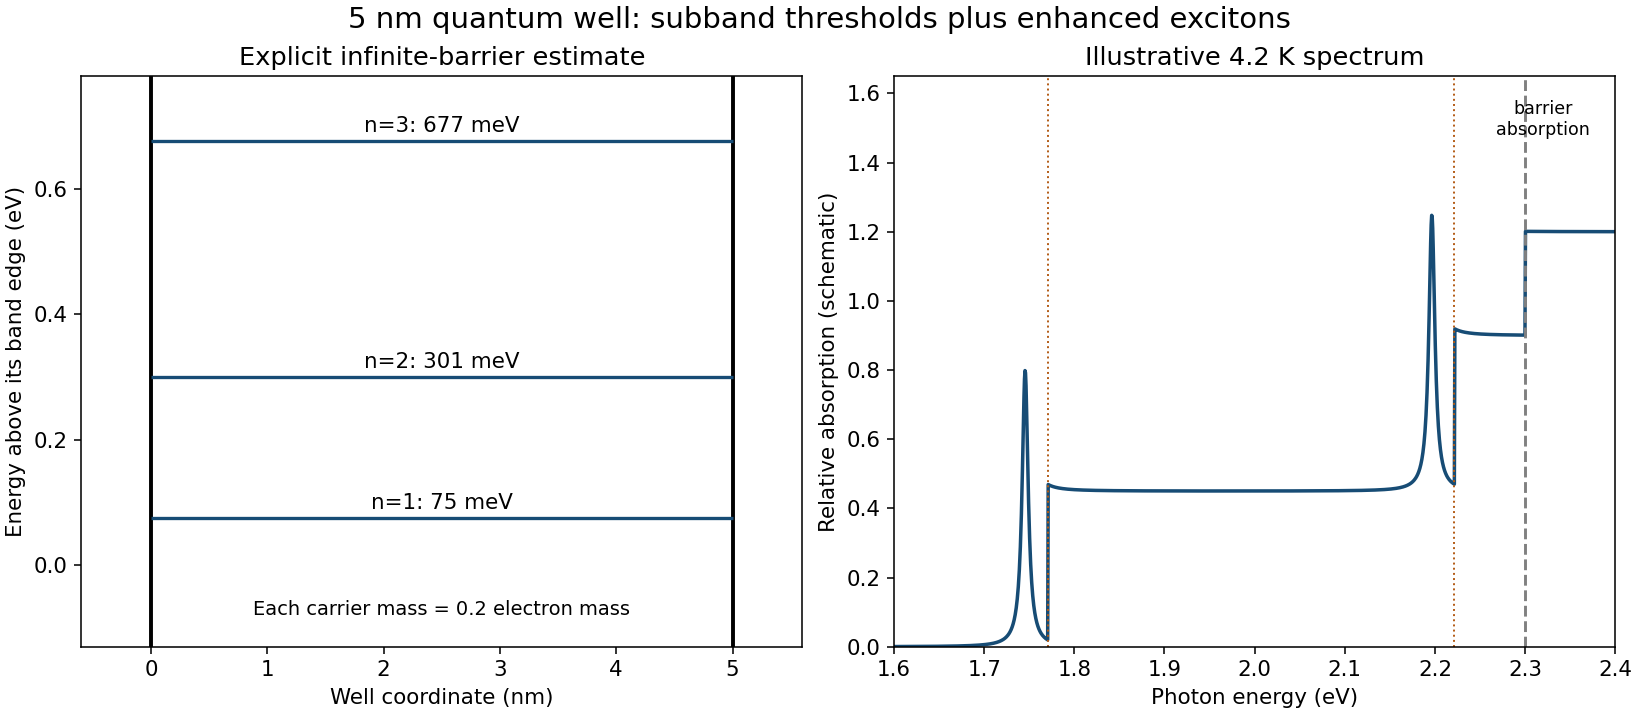
Assume type-I confinement of both carriers, and first use an infinite square well as an explicit estimate. For thickness nm and each carrier mass , confinement measured from the corresponding well band edge isThus the first three infinite-well levels are approximately , and meV for each carrier. Interband envelope overlap favors matching quantum numbers when the electron and hole well profiles are the same. Ignoring exciton binding energy initially, their absorption thresholds areThe first two lie in the requested optical window. Two-dimensional subband joint densities of states produce step-like onsets, with excitonic peaks just below them, rather than only a bulk three-dimensional onset. Confinement strengthens electron–hole binding: the ideal strict-two-dimensional hydrogen ground binding is meV, while a finite-width well interpolates toward the bulk value near meV. The nm width is comparable to the bulk exciton radius, so neither limiting binding value is exact. A schematic based on the infinite-well estimate therefore has first exciton peaks around – eV and – eV, followed by their subband continua; the eV barrier absorption is another feature near the top of the requested window.
The barrier gap alone does not specify the finite confinement energies. Under type-I alignment it supplies only eV. It does not give their division or the barrier effective masses, and a larger gap by itself does not prove type-I alignment. Infinite-well levels are consequently estimates, not uniquely determined measured levels.
For a concrete conditional comparison, assigning equal eV electron and hole barriers and taking the same mass on both sides gives finite square well levels , and meV per carrier. These follow from for even levels and for odd levels, with , . The corresponding unbound-pair optical thresholds would be , and eV before exciton shifts. This example is deliberately conditional and demonstrates why band offsets must not be invented to make a unique finite square well spectrum. The requested schematic below states which approximation it uses.

Articles by others on the same topic
There are currently no matching articles.