The graph of the positive-delay probability density function is a horizontal segment at height from to , followed by zero from to . Values at individual endpoints do not affect probabilities. The separate atom at zero is not a finite-height part of this density graph.
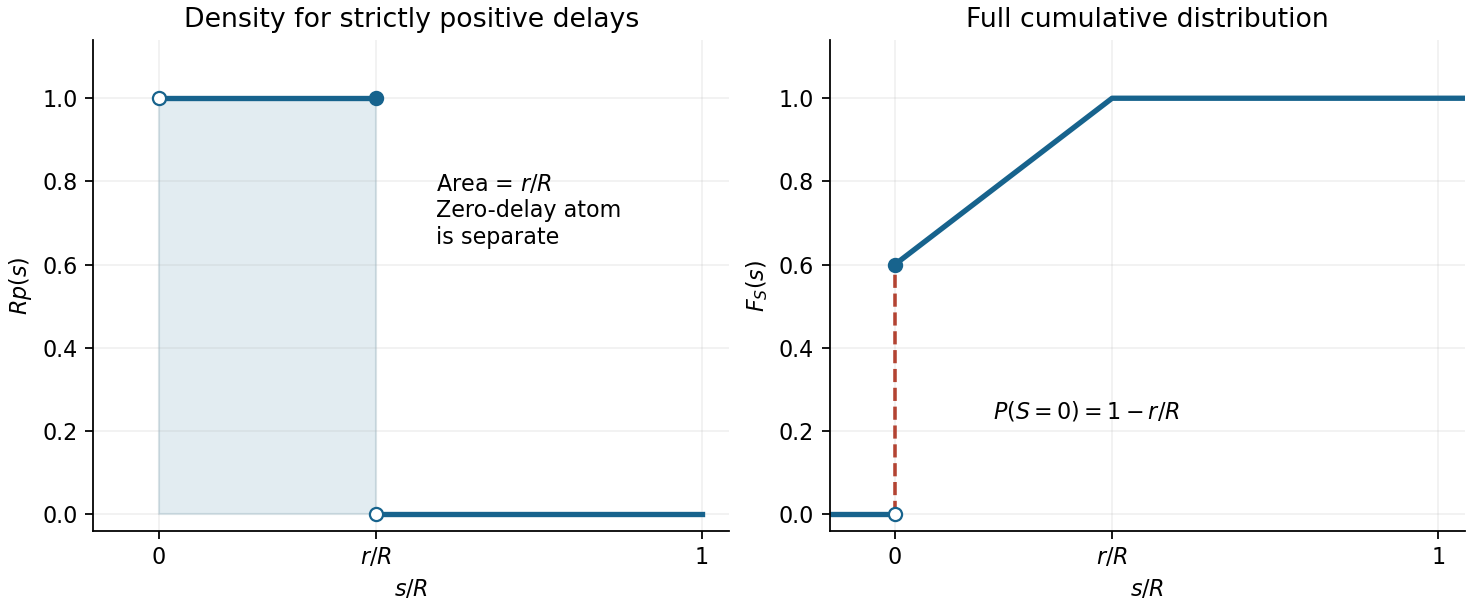

The companion cumulative distribution function in the figure is for , for , and for . Its jump at zero displays the discrete part without confusing density height with probability mass.
Articles by others on the same topic
There are currently no matching articles.