Subduction zone segmentation is the observation that slab structure, fault slip and upper-plate behavior change along a margin; their boundaries need not coincide exactly. In Cascadia, it is documented by several independent measurements.
Onshore GNSS velocities, coastal leveling and tide gauges constrain along-strike changes in megathrust locking and interseismic uplift. Episodic tremor and slip has distinct recurrence and migration patterns, and its occurrence is lower in parts of central Oregon than farther north and south. Coastal geological records constrain differences in coseismic subsidence and the extents of past ruptures. Those observations sample different depths and time windows, so a present-day locking boundary should not automatically be declared a permanent earthquake rupture barrier. A 2014 analysis found persistent central-margin partial creep compatible with reduced uplift, reduced paleoseismic subsidence and lower cumulative slow slip.[ref]
Central Cascadia subduction zone creep by Gina M. Schmalzle and others. Conclusions, central Cascadia approximately 43–46°N and comparison of GPS, uplift and paleoseismic observations
A physically specific hypothesis links these variations to subslab mantle buoyancy. An onshore–offshore seismic tomography study imaged low-velocity asthenosphere beneath northern and southern Cascadia, spatially associated with stronger plate locking and more tremor, with different central-margin structure. Warmer or partly molten asthenosphere can be less dense. Its buoyant traction can push upward against the slab and change contact stresses on the megathrust. Hotspot-influenced material is one proposed northern source; three-dimensional deformation near the Gorda region offers a southern upwelling mechanism.[ref]
Buoyant Asthenosphere Beneath Cascadia Influences Megathrust Segmentation by Miles Bodmer and others. Abstract; sections 3 and 4, onshore–offshore tomography and proposed northern/southern buoyancy sources
There are additional controls. The Siletzia basaltic basement beneath the overriding plate varies in extent and thickness. Its permeability and stiffness can affect fluid escape and fault stresses: poorly drained material can preserve high pore pressure, lower effective normal stress and promote creep. Along-strike changes in incoming plate age, slab dip, fracture-zone hydration, sediment supply and plate-edge stresses can also modify the thermal and frictional environment. Central-margin creep has specifically been associated with the distribution of Siletzia and inferred fluid trapping.[ref]
Central Cascadia subduction zone creep by Gina M. Schmalzle and others. Discussion and conclusions, Siletzia gravity signature and the permeability/fluid-pressure interpretation
How do we distinguish these causes? Offshore and onshore seismic arrays test the geometry of the anomalies; resolution and synthetic-recovery tests determine whether apparent segmentation could result from uneven station coverage. Seismic attenuation, anisotropy, magnetotelluric sounding, rock physics and heat-flow data help separate temperature, melt, water and composition. Gravity anomalies and seismic interfaces constrain basement and slab geometry; geodetic inversions test whether the inferred locking pattern persists across plausible fault geometries. Forward models then ask whether the measured density or pore-pressure contrasts produce stresses and slip patterns of the required size and sign.
Segmentation is observed robustly; a unique cause is not established by spatial correlation alone. Seismic velocity is not a direct density measurement, central creep and deep tremor are not the same phenomenon, and multiple coupled structures can reinforce one another. The buoyant-mantle and upper-plate fluid hypotheses are testable explanations rather than mutually exclusive certainties.
Yes: substantial along-strike segmentation is expected and observed in the Andes, but its geometry and dominant controls need not match Cascadia. The older Nazca Plate has a thicker cooled lithosphere and a larger thermal density excess relative to hot mantle than the young Juan de Fuca system. In a half-space cooling model, thermal thickness scales as , so the age comparison alone gives a thickness ratio . This changes the balance of slab buoyancy, bending resistance and mantle flow; it does not make the margin laterally uniform.
Changes in incoming ridge and plateau buoyancy, hydration, fracture zones, convergence obliquity, upper-plate thickness and motion can all alter slab dip and coupling. The Peruvian and Pampean flat-slab regions illustrate this: long nearly horizontal slab sections contrast with steeper subduction beneath active arc sections. Suppression or displacement of a hot mantle wedge explains why flat-slab subduction can coincide with volcanic gaps and deformation farther inland. The steeply dipping slab beneath much of the central Andes should not be conflated with every Andean segment.
The Juan Fernández Ridge is associated with the Chilean/Pampean transition, while the Nazca Ridge intersects the Peruvian system. However, association is not proof that crustal thickness alone supplies all the buoyancy. Wide-angle seismic observations at the Juan Fernández system found only moderate crustal thickening and motivated consideration of hydration as well as ridge emplacement.[ref]
Seismic investigations of the O'Higgins Seamount Group and Juan Fernández Ridge by Heidrun Kopp and others. Abstract and introduction, seismic profiles, flat-slab association and limits of a crustal-buoyancy explanation
The same combination of slab imaging, geodesy, volcanic chronology and incoming-plate characterization is needed to test causes. Thus the transferable idea is lateral variation in forces and material properties, not an identical three-segment pattern or one age-controlled mechanism.The supplied plot gives surface heat flux, not a whole-crust mean temperature. At young ages its scatter is substantial. Representative readings suitable for an order-of-magnitude conductive calculation are near Ma and near Ma; plausible graphical ranges are roughly – and –, respectively. These are approximate choices within the plotted population, not uniquely determined statistical means or a digitization of its red curve.
Assume the same normal oceanic crustal thickness km, seafloor temperature , negligible internal crustal heating and a linear conductive profile. These are additional assumptions; the paper supplies conductivity but not thickness. With depth positive downward and the magnitude of the upward flux, Fourier's law givesThis is the crustal mean temperature from conductive heat flow, not the basal temperature, which is twice the excess above . Substitution of givesA sensible rounded answer is therefore about for the young crust and for the old crust, with a representative contrast K. The corresponding basal values are about and . The quoted graphical ranges instead yield mean temperatures about – and –, at the same assumed thickness.
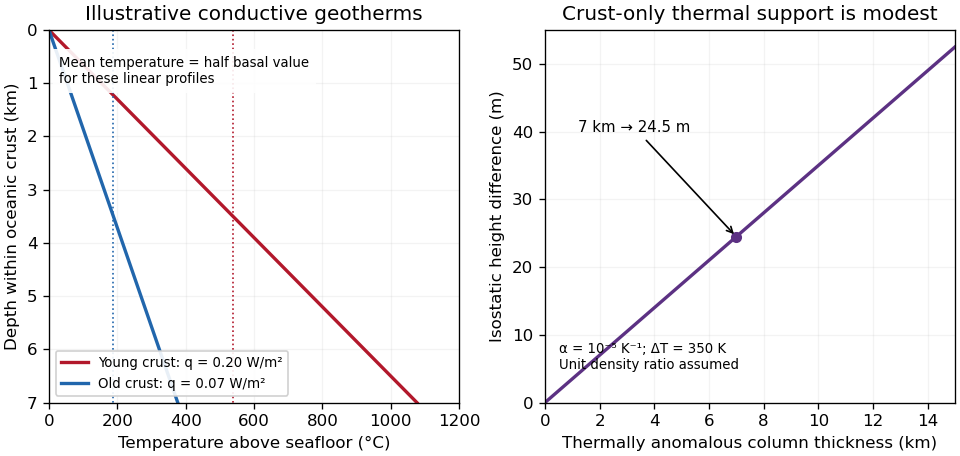
Original conductive temperature estimates and their crust-only thermal-buoyancy scaling; thickness, linear profiles and representative fluxes are explicit assumptions
. Details. 
The temperatures scale linearly with . Hydrothermal circulation can redistribute heat, especially in young permeable crust, and measurements through sediment need not equal the purely conductive cooling-model flux everywhere. The supplied study explicitly addresses the resulting oceanic heat-flow deficit.[ref]
Oceanic heat flow: implications for global heat loss by Derrick Hasterok and others. Abstract, hydrothermal circulation and low conductive measurements in young seafloor; examination Figure 2 supplies the filtered observations
Thus the calculation gives plausible incoming-crust averages under a stated model, not the entire plate's temperature or its later temperature at depth in the subduction zone.Using the preceding conductive estimate, warmer incoming crust is less dense. Interpret the given as the volumetric coefficient entering . The representative contrast givesFor , that is only about . Let be the vertical thickness of the anomalous slab material in a compensated column. Its mass deficit per unit area is approximately . If uplift adds compensating column mass , isostatic balance gives the thermal buoyancy support of topography:The reference density depends on which interfaces move in the assumed column model. For approximately equal densities and a near-horizontal km crustal layer, this gives m; using and gives about m. A modest dip changes the vertical intersection to approximately and does not change this order of magnitude. Different graphical flux choices and uncertain geometry change the number; they do not justify replacing a km crustal anomaly by a whole km lithospheric anomaly without additional information.
Thus the crust-only thermal contrast can supply tens of metres of isostatic relief, not kilometres. Its sign would favor greater thermal support from the warmer Juan de Fuca crust, so it cannot by itself explain why much of the central Andes stands higher than Cascadia. Crustal shortening and roots, whole-slab thermal structure, phase transformations, hydration, magmatic addition and dynamic stresses can dominate. If the stated expansion coefficient instead meant a linear solid expansion coefficient, the first-order density coefficient would be about three times larger; the estimate would still be well below kilometre-scale mountain relief.
To test isostasy, jointly measure surface topography, free-air gravity anomalies, Bouguer gravity anomalies and crustal thickness from receiver functions and seismic refraction surveys. An Airy isostasy interpretation predicts crustal roots beneath high terrain and a corresponding regional negative Bouguer signal; thermal or compositional compensation predicts different density structure. Compare gravity and geoid observations with compensated-column predictions over a range of wavelengths, and use gravity-topography admittance to test local versus flexural isostasy. A small long-wavelength free-air anomaly can support compensation, but is not a sufficient test by itself. GNSS uplift, leveling and dated marine or river terraces constrain transient or sustained vertical motion; seismic tomography and rock-density estimates constrain deeper buoyancy. Residual relief or gravity after these corrections may require dynamic topography or tectonic support. An actively deforming subduction margin need not satisfy instantaneous local isostatic equilibrium, even if the estimate above is a useful scale comparison.
Articles by others on the same topic
There are currently no matching articles.