The correlation function of a point process is even and tends to zero as . Its derivative factors asConsequently its local maxima occur at , and its local minima at . The heights are
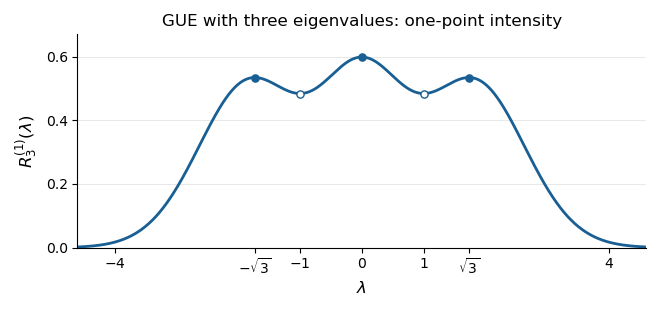
The three peaks of the GUE one-point correlation function
. Original plot of the exact correlation function of a point process calculated above. Filled markers indicate local maxima at ; hollow markers indicate the local minima at . The total area is three. Details.
For an interval , is the expected value of the number of eigenvalues in . Thus equally short intervals have the highest expected counts nearwith the central peak highest. Each exchangeably labelled eigenvalue has the same marginal probability density function . The three peaks should not be interpreted as three separate marginal densities for ordered eigenvalues.
In this case the most likely joint configuration also lies at these three positions. On the ordered chamber, the logarithm of the joint probability density function, up to a constant, isIts stationary equations are , satisfied by . For every nonzero real vector , the second directional derivative isThus is strictly concave on this convex chamber, proving that the stationary configuration is its unique global maximum. Permuting the labels gives the other maxima on .
Articles by others on the same topic
There are currently no matching articles.