A spiral galaxy has a rotating stellar/gas disk with spiral structure, central bulge, extended halo and globular clusters, embedded in a still larger dark-matter distribution. For the Milky Way useful rough scales are a stellar-disk diameter of a few tens of kiloparsecs, a thin-disk thickness of a few hundred parsecs, a bulge scale of kiloparsecs and a halo extending tens to hundreds of kiloparsecs depending on tracer. Young stars follow gas-rich star-forming disk regions and spiral arms. Very old stars are prominent in globular clusters, halo and bulge, though the disk also contains old populations. These are distributions with overlapping ages, not disjoint bins.
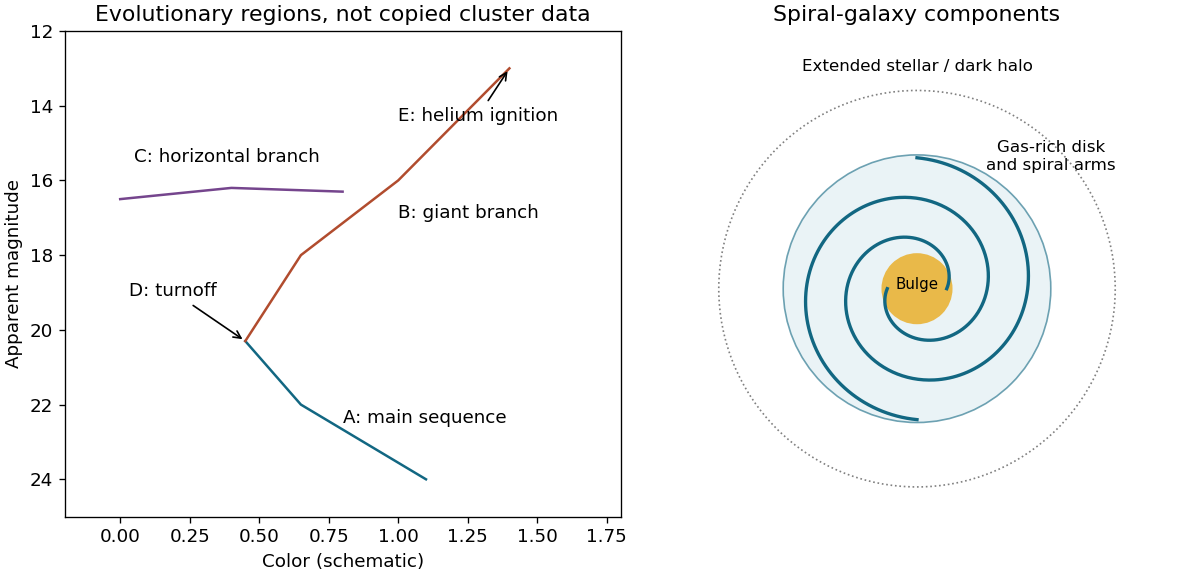
Schematic stellar evolutionary regions and spiral-galaxy components used in the solutions
. Details. 
The 21.1 cm line is neutral hydrogen's hyperfine spin-flip transition, observed with radio telescopes and interferometers in the cool/warm neutral gas disk, often beyond the bright stellar disk. The mean wavelength gives z=22.0/21.1−1≃0.0427 and, using the stated low-redshift Hubble approximation, d≃180 Mpc. A 16-arcsecond angular radius gives R≃14 kpc. For a thin circular disk, cosi=8/32, so i≃75.5∘ from face-on.
The original spectrum reaches roughly 21.98 and 22.02 cm: vlos,max≃c(0.02/22.0)≃273 km s−1. Deprojecting gives vmax≃282 kms−1. A spherical dynamical estimate M(<R)≃v2R/G gives M∼2.6×10¹¹M⊙. A thin massive disk is not spherical: its exact rotation-to-total-mass coefficient depends on radial mass profile. The no-exterior-matter assumption does not uniquely fix that coefficient, so the quoted result is the conventional order-of-magnitude dynamical estimate. Cosmological luminosity and angular-diameter distances differ at this redshift; the source's simple Hubble-distance convention is being used consistently.
The low-redshift distance gives modulus about 36.28, so MV≃−20.28 and LV≃1010L⊙. A stellar mass-to-light ratio of order one to a few would imply only 1010–several 1010M⊙ in stars, below the dynamical estimate. Gas and a dark component can supply additional mass; the precise stellar estimate requires a population-dependent mass-to-light ratio and extinction correction.
An exponential luminous disk has most of its mass within a few scale lengths. Outside that concentration a mass-traces-light model tends toward a declining, approximately Keplerian speed, not an extended flat curve. Adding a spatially extended mass distribution explains the mismatch more naturally than merely rescaling the same concentrated light profile.
Use an explicit Tully-Fisher-type scaling L∝vmax4 for comparable spiral populations and photometric band. Relative to the preceding galaxy,The exponent and normalization are empirical and have scatter; one galaxy alone does not establish the relation. Different stellar populations, inclination errors and extinction change the photometric inference.
L2∼1010(100/282)4L⊙∼1.6×108L⊙.
Ancestors (10)
- S26
- 2016
- Past exam of the short options paper shared by Prelims and Parts A and B of the physics course of the University of Oxford
- Short options paper shared by Prelims and Parts A and B of the physics course of the University of Oxford
- Physics course of the University of Oxford
- Undergraduate course of the University of Oxford
- Course of the University of Oxford
- University of Oxford
- List of universities
- Home
Discussion (0)
New discussionThere are no discussions about this article yet.
Articles by others on the same topic (0)
There are currently no matching articles.