Section B: Remote Sensing & Active Tectonics.
For regional coverage, use stereo photogrammetry from overlapping satellite or airborne imagery, or a radar-derived digital elevation model where suitable data exist. Match the same terrain features in images taken from different known viewing positions, infer their three-dimensional positions by triangulation, and georeference and grid the result. Satellite stereo or interferometric radar can cover efficiently; choose pixel size and vertical precision fine enough for the fault scarps of interest, rather than assuming every regional model resolves small scarps.
InSAR topographic mapping uses the phase difference from a known viewing baseline; repeat-pass deformation work must separate that height contribution from actual motion. Vegetation, cloud, radar shadow and steep slopes can leave gaps or represent the canopy rather than bare ground.[ref]
Interferometry by NASA. Topographic mapping with separated viewing positions and the known baseline; DEM construction
Ground control and independent elevation checks are needed before interpreting small relief as active faulting.Use airborne lidar with sufficient pulse density and ground-return classification. Laser travel times give ranges; the aircraft’s surveyed position and orientation place returns in three dimensions. Multiple returns include canopy and, where gaps permit, the ground. Classify ground points, remove vegetation returns and interpolate a bare-ground digital elevation model over the strip.
This specifically addresses the forest-obscured fault scarp, unlike ordinary optical stereo, which primarily models the visible canopy. Leaf-off acquisition can improve ground sampling where relevant. Dense understorey and a complete lack of ground returns still cause uncertainty; interpolation does not create observed ground heights. Inspect ground-point coverage and compare hillshades under several illumination directions.[ref]
What is the difference between lidar data and a digital elevation model by United States Geological Survey. Point clouds, vegetation removal and the bare-earth product
Use low-altitude structure-from-motion photogrammetry, with strongly overlapping aerial images and well-distributed surveyed ground control points. Bundle adjustment estimates camera geometry and a dense surface reconstruction; independent check points test its accuracy. A small unmanned aircraft or carefully controlled close-range aerial platform can cover the site with centimetre ground sampling. Surveyed targets and stable camera calibration are essential: centimetre pixels alone do not establish centimetre vertical accuracy.
For exposed trench walls or especially demanding local geometry, terrestrial lidar is an alternative or complement. Remove vegetation where permissible, retain the trench’s sharp topographic breaks and state whether the output is a visible surface model or a bare-ground digital elevation model.
Use normalized image coordinates within the map rectangle, with at its upper left and at its lower right. A principal candidate thrust fault trace follows the sharp, approximately diagonal southwestern edge of the dissected high ground on the right: a practical tracing guide passes nearMark the upland, upper-right side as hanging wall and the smoother, lower-left basin side as footwall for a thrust dipping beneath the uplands. Use broken lines through the gaps, not one asserted continuous exposed rupture. A subsidiary candidate frontal segment follows the basin-facing edge of the isolated dissected ridge on the left, approximately through to ; place teeth toward its locally higher ridge side.
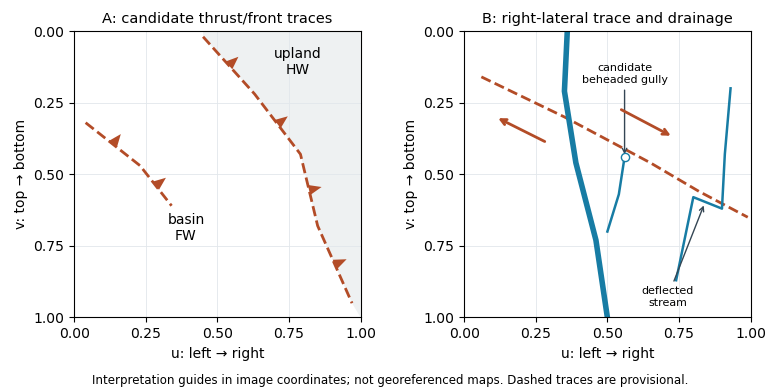
Original interpretation guides for both attachments: provisional traces, block motion and drainage markers in normalized image coordinates
. Details. 
These are geomorphic interpretations of mountain fronts and scarps, not measured subsurface dip directions. On a conventional north-up reading the principal trend is broadly northwest–southeast, but the supplied map has no north arrow: the image-relative coordinates are the reproducible identification. Southwestern illumination means southwest-facing slopes are bright; brightness is a slope-orientation clue, not an elevation contour. Some aligned relief may be a fold scarp or an eroded lithological contact, so field confirmation and topographic profiles would test the candidate traces.
After removing orbital, topographic and atmospheric contributions, an earthquake InSAR radar interferogram would show elongated displacement lobes and generally closed or nested fringes associated with uplift and horizontal shortening of the hanging wall. Each full phase cycle represents of line-of-sight displacement, where is radar wavelength; equivalently , with sign fixed by processing convention.[ref]
Interferometry by NASA. Phase differencing, nuisance contributions and half-wavelength displacement per fringe
If primary slip reaches the surface, expect a displacement discontinuity across the surface trace: fringes can terminate or change abruptly there, and large near-fault gradients or disturbed ground may decorrelate. For a blind reverse fault, the elastic displacement field is continuous at the ground surface and spread over a broader zone, giving smoother gradients and fringes over the uplifted fold. A blind rupture can still create sharp local gradients or secondary faulting.
The exact colour order, number of fringes and sign of the displacement lobes cannot be fixed from this shaded relief alone. They depend on slip, depth and radar look direction; uplift is only one contribution to line-of-sight displacement.
A blind reverse fault can shorten and bend its cover into a fault-propagation fold or other growing anticline. At the fold crest, bending can create shallow extension and secondary normal faults or tension fissures, even though the regional deformation is shortening. Bedding-parallel flexural slip, local backthrusts and fold scarps can also break the surface.
Thus a shallow surface break need not be the upward continuation of the main seismogenic thrust fault. The expected association is distributed deformation related to the uplifted fold; its detailed pattern depends on cover layering, fold geometry and shallow strength. The broad frontal relief in Attachment A is compatible with this possibility, but the image alone does not establish a unique earthquake rupture history.
Articles by others on the same topic
There are currently no matching articles.