Source release: www.whatdotheyknow.com/request/earth_science_past_papers_and_ex/response/3419815/attach/4/Papers.zip?cookie_passthrough=1
Let be the fraction of the pore space occupied by gas, and let be the porosity. At fixed porosity and unchanged rock framework, the bulk density isReplacing water with much less dense gas therefore decreases the bulk density approximately linearly, as in Figure 1. The liquid and gas densities here are those at reservoir conditions.
A pore fluid has negligible static shear modulus, so the rock framework chiefly controls the effective shear modulus . If changes little, increases gently as the density falls. This does not imply that S waves travel through the pore gas itself: their restoring force comes from the connected solid framework.
The P wave speed depends on both bulk modulus and shear modulus:Gas is much more compressible than water. Even a small connected gas fraction can strongly reduce the effective fluid bulk modulus, approximately through the compliance average for a pressure-equilibrated mixture. The saturated rock's effective bulk modulus consequently falls rapidly at first, overwhelming the smaller density reduction and causing the sharp initial fall in . Once the fluid is already very compliant, further gas replacement changes the stiffness less; the continuing density decrease can then make rise again. Figure 1 assumes a particular saturation response: patchy fluids, changing effective pressure, and frequency-dependent fluid motion can alter it. The plotted is only nearly constant, so the plot should not be interpreted as an exact fixed- constitutive model.
For incidence from cap rock (1) into reservoir (2), use the conventional normal-incidence stress-amplitude reflection coefficientHere acoustic impedance is the P wave impedance; is the corresponding shear-wave impedance. Positive preserves the chosen stress-wave seismic reflection polarity; negative reverses it. These are amplitude coefficients, not reflected energy fractions. At normal incidence in the ideal isotropic model there is no P-to-S mode conversion. The cap-rock impedances are
The following are approximate readings of the supplied Figure 1 PNG, checked against the matching source PDF, rather than exact tabulated parameters. At zero gas, use , , and ; at full gas use , , and . The left-hand endpoint is crowded against the axis and the density curve; readings differing by roughly in the plotted units are reasonable. The resulting coefficients deserve about two significant figures, not the apparent precision of the intermediate arithmetic.
Both end members change seismic reflection polarity, but the P wave change is much larger: approximately to , compared with to for S waves. Thus a calibrated P wave survey is better for distinguishing these two saturation end members and should give a stronger reflection from the fully gas-filled reservoir. A negative P wave reflection relative to the water-filled prediction is a useful gas indicator in this stipulated model. In a real seismic reflection survey, lithology, porosity, effective pressure, and seismic wavelet phase also affect the response, so a bright or reversed reflection alone does not prove the presence of gas.
For the fully water-filled reservoir, the approximate densities and wave speeds giveand henceBoth are positive: the reservoir has larger P wave and shear-wave impedances than the cap rock, and neither reflection reverses the chosen stress-wave seismic reflection polarity.
For the fully gas-filled reservoir,soBoth impedances are now smaller than those of the cap rock. Both reflections reverse seismic reflection polarity, with a substantially larger amplitude for the P wave reflection. Reading the right-hand endpoint instead as would give , preserving the interpretation.
The P wave source is normally the more useful depth source for the end members and for the stated approximately 50% gas case, because the predicted exceeds , making the reservoir-top arrival easier to identify, assuming comparable source and recording quality. For a horizontal reflector and vertical two-way travel time entirely through the homogeneous cap rock,or for an identified S wave arrival, with times in seconds. The reservoir's own wave speed is not the overburden wave speed used in this conversion. Nonzero-offset data require moveout correction and an appropriate overburden velocity model; no numerical depth can be obtained without a measured time.
At approximately 50% gas, Figure 1 gives , , and –. ThusThe S wave reflector is then weak because its impedance is nearly matched to the cap rock. An exact impedance match, , gives : a reservoir top can exist without producing an observable normal-incidence S wave reflection. Rounding the 50% to would suggest exactly that cancellation, but the plotted line sits slightly higher. The continuous curve crosses the cap-rock value at a somewhat greater saturation; the coarse figure does not justify a precise percentage.
There is also a smaller-saturation P wave impedance match: changes sign between zero and modest gas saturation, so it must pass through zero. Thus neither source guarantees a detectable reflector at every saturation. Joint P wave and S wave observations help distinguish a weak impedance contrast from an absent reservoir; a slower S wave speed alone is no reason to prefer it when its reflected amplitude is near zero.
A proton-precession magnetometer measures the scalar magnitude of the local magnetic field. Its sensor contains a proton-rich liquid, such as a hydrocarbon or suitable water-based fluid. A strong current through a coil briefly polarizes the nuclear magnetic moments, producing a small net magnetization. The polarizing field is directed sufficiently across the local magnetic field to leave a transverse component when the current is switched off.
The protons then undergo Larmor precession about the ambient magnetic field. Their rotating net magnetization induces a decaying alternating voltage in a receiving coil. Measuring the frequency determines the field:For example, gives about . The known proton gyromagnetic ratio provides an absolute frequency-to-field scale; this instrument does not measure the field's direction. Strong spatial gradients cause different parts of the liquid to precess at different rates and shorten the usable signal, which matters very close to a buried steel object.[ref]
G-857 Memory-Mag operation manual by Geometrics. Introduction, “What is a total field magnetometer?”, and “Magnetic Environment”; scalar intensity and sensitivity to gradients.
Lay out a surveyed grid extending beyond the possible burial area into unaffected ground. Use closely spaced parallel traverses with measurements along each line; spacing should resolve a car-scale magnetic anomaly, with a finer grid over any candidate. For a shallow car, a pilot survey with roughly metre-scale spacing is a sensible starting point, refined according to anomaly width rather than treated as a universal prescription. Record position, time, sensor height, repeat readings and any nearby interference. Cross-lines and repeat stations check reproducibility. Maintain a constant sensor height on a nonmagnetic staff and remove magnetic items from the operator; map fences, gates, pipes, buildings and vehicles before interpreting an anomaly.
Operate a synchronized stationary base-station magnetometer in quiet ground while the rover surveys, or make frequent base returns if a second instrument is unavailable. A total-field magnetic anomaly is the corrected field magnitude minus a specified background:For a field-sized target, a local background estimated away from the car is often sufficient. A larger regional survey may subtract the International Geomagnetic Reference Field and an independently justified regional trend. Do not remove the car's broad anomaly by overfitting that trend.
Correct rover observations for time-varying geomagnetic field using the base record, for example . Check instrument offsets and tie-line differences, reject disturbed or poor-quality readings, and allow for differing sensor heights. Preserve localized target signals when interpolating a contour map or comparing with a magnetic dipole model. There are no compulsory gravity-style free-air or Bouguer gravity anomaly reductions for this magnetic search.
Postpone surveying during a geomagnetic storm or rapid irregular magnetic variation, when base correction may be inadequate. Avoid periods of moving farm machinery or electrical interference, and recognize that strong permanent cultural interference or highly magnetic host rock may make this particular method unsuitable. Ordinary cloud cover or darkness does not prevent a magnetic survey.[ref]
G-857 Memory-Mag operation manual by Geometrics. “Magnetic Environment” and survey/base-station operation: magnetic cleanliness, spatial gradients, and time variation.
Strong geological magnetic anomalies generally occur in rocks containing abundant strongly magnetic iron oxides, especially magnetite and titanomagnetite. Many mafic rocks, including basalt and gabbro, and some ultramafic rocks have large signatures; magnetite-rich iron formations can be exceptionally strong, while serpentinization can create additional magnetite. Actual magnetic susceptibility and remanent magnetization, rather than the rock name alone, determine the response. Sedimentary and felsic rocks are often weaker but have important exceptions.
Magnetite, titanomagnetite and maghemite exhibit strong ferrimagnetism; some pyrrhotite is also strongly magnetic. Hematite is generally much weaker in induced magnetic susceptibility, although it can carry stable remanent magnetization. Quartz and calcite have very small, usually negative, susceptibilities, and many ordinary silicates have only weak paramagnetism. A steel car exhibits strong ferromagnetism and can therefore stand out against a weakly magnetic host, but its shape and pre-existing remanent magnetization complicate the signal.[ref]
Applications manual for portable magnetometers by Geometrics. Rock-susceptibility discussion and the section “Remanent or Permanent Magnetization”.
The sketches assume the car can be approximated by a compact magnetic dipole whose induced magnetic moment is parallel to the local geomagnetic field. The host contributes negligible local contrast. Real steel also has remanent magnetization and shape-dependent magnetization, so the car's actual profile need not follow this idealization. A proton-precession magnetometer observeswhen . This scalar total-field magnetic anomaly must not be confused with a fixed vertical field component. For induced , the magnetic dipole field givesReversing both the inducing field and induced moment leaves this total-field magnetic anomaly unchanged, exactly for the magnitude definition as well as in the weak-anomaly approximation.[ref]
Magnetic surveying: induced magnetization by UBC Geophysical Inversion Facility. Buried-dipole examples at the magnetic equator and magnetic pole; total-field projection and traverse orientation.
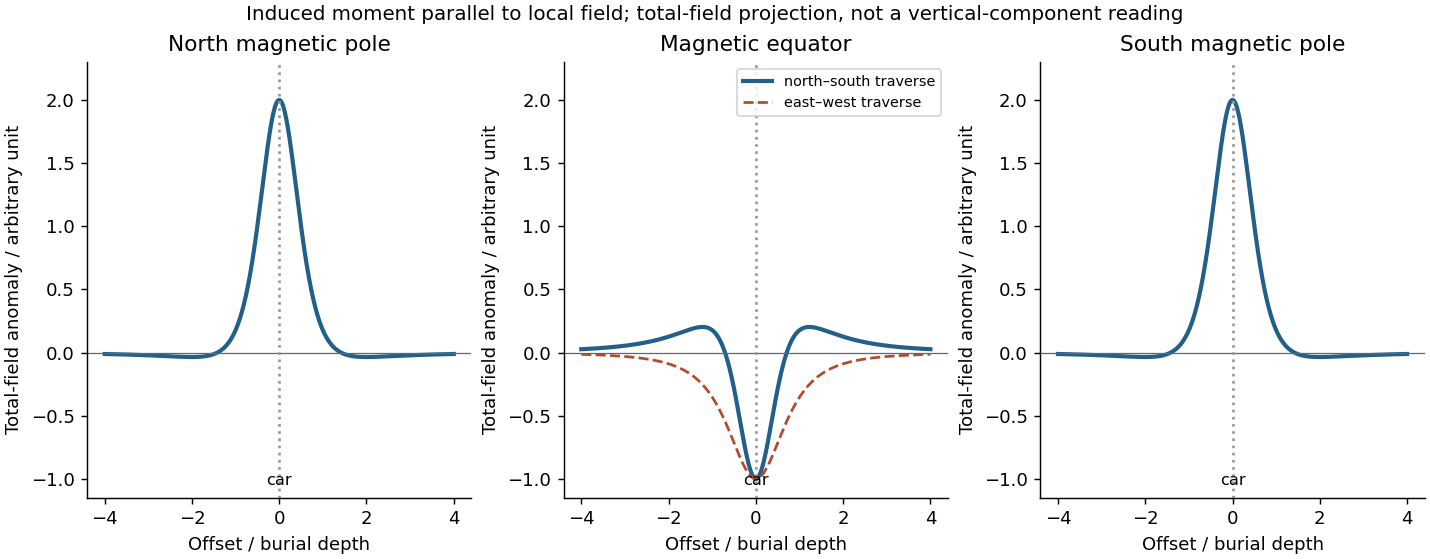

Near the north magnetic pole, take the inducing magnetic field and induced magnetic moment as vertically downward. Directly above the car, its anomalous field reinforces the main field: a positive central total-field magnetic anomaly results. Along a horizontal traverse, the vertical-dipole approximation gives a symmetric central high flanked by weaker negative side lobes:where is the depth from the sensor to the effective dipole centre. The anomaly width scales with ; no absolute amplitude can be calculated without the car's magnetic moment.
At the magnetic equator, the inducing magnetic field and induced magnetic moment are horizontal. Let point along this field, approximately magnetic north, and across it. Directly over the car, the dipole field opposes the main field, producing a negative central total-field magnetic anomaly. A north–south traverse through the car givesa symmetric central low with positive shoulders. An east–west traverse through the car instead has , a single negative trough. The equatorial anomaly therefore needs a stated traverse orientation; there is no universal single equatorial line profile.
Near the south magnetic pole, the inducing magnetic field and induced magnetic moment are vertically upward. Directly over the car its dipole field is also upward, again reinforcing the main field. The total-field magnetic anomaly is therefore the same positive central high and weak negative side lobes as at the north magnetic pole under the same induced-dipole assumptions. A fixed signed vertical field component would reverse, but the scalar field strength measured by the proton-precession magnetometer does not. If the car's remanent magnetization dominates, neither this symmetry nor these predicted signs is assured.
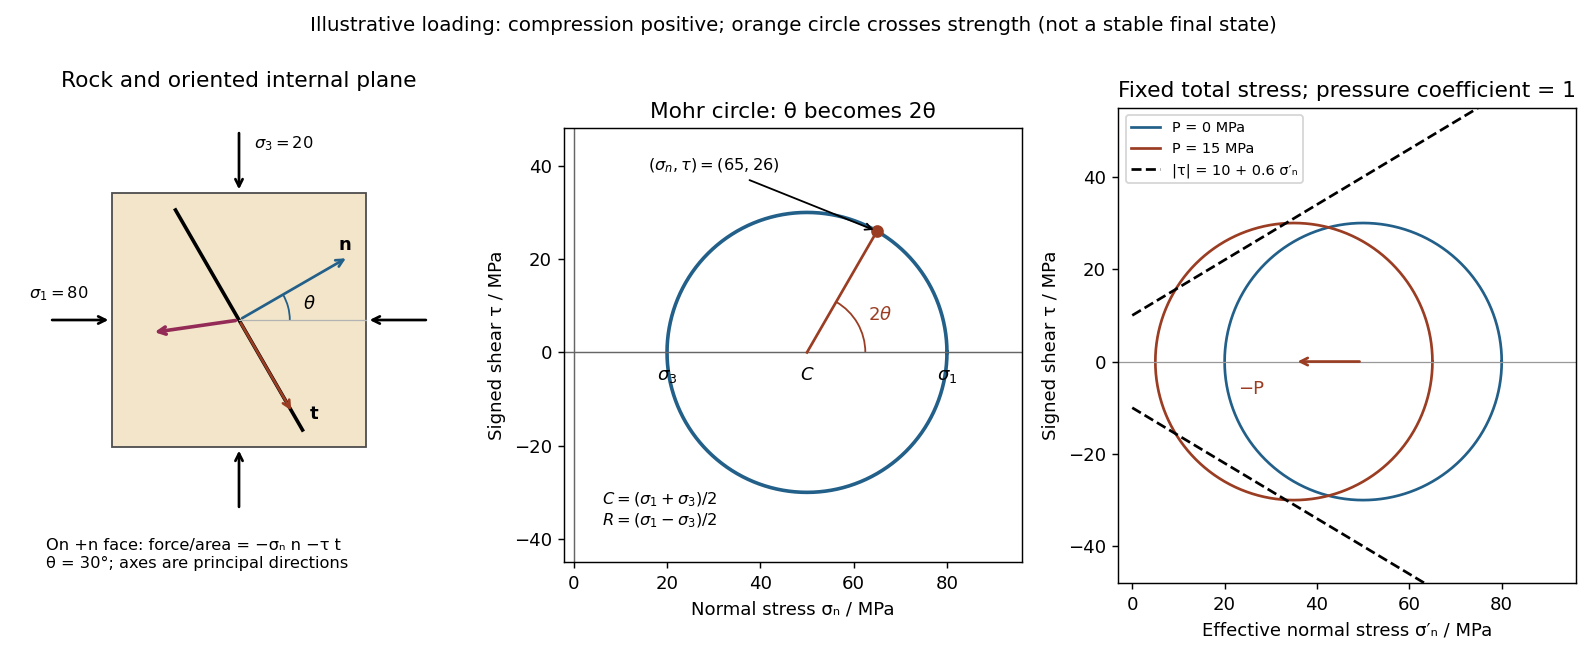
Use compression-positive principal stresses . The two-dimensional Mohr's circle shown is the – circle: its horizontal axis is compressive normal stress , its vertical axis signed shear stress , its centre is , and its radius is . The intercepts and represent principal stress planes, on which shear stress vanishes. The top and bottom points have , the maximum shear stress.
In the rock sketch, is the counterclockwise angle from the direction to the plane's unit normal vector . Choose the clockwise unit tangent and define , with compression positive. Thus a positive produces a positive rotation on the plotted circle. The actual traction on the positive-normal face is . Reversing the tangent convention reverses the plotted shear sign, not the physical prediction.
Stressed rock, Mohr circle, and the effect of pore pressure
. Original illustrative construction with principal compressions 80 and 20 MPa and a plane normal 30 degrees from the maximum compression. The circle point is approximately (65,26) MPa at twice that angle. A separate panel translates the circle left by 15 MPa pore pressure at fixed total stress, bringing it to a frictional failure envelope. Details.
In three dimensions there are circles for each pair of principal stresses. The largest is the – circle; a general three-dimensional plane requires all three principal stresses and its normal, rather than a single angle on this circle.
For a plane whose normal lies in the – plane, rotate through from in the stated sign convention. The circle point givesThe normal-to-plane angle is essential: if the angle supplied is between the plane itself and , use its complement for . The principal stress planes have zero shear stress, and planes at to those principal stress planes have maximum .
For an arbitrary plane in a fully three-dimensional stress field, let be its direction cosines in the principal stress basis. ThenThese follow by resolving the traction into its normal and tangential components; the compression-positive tensor is the negative of the usual tension-positive Cauchy stress tensor. The family of Mohr circles visualizes the possible combinations, but the two-dimensional rule alone does not specify an arbitrary three-dimensional orientation.[ref]
Draw a failure envelope in the plane. A useful brittle shear-failure approximation is the Mohr-Coulomb failure criterionwhere is cohesion, the internal friction angle, and the effective compressive normal stress. A circle wholly inside the envelope is below this ideal failure threshold. Increasing the differential stress expands it until it first touches the envelope: the tangent points identify the failing plane orientations. For a linear envelope, tangency impliesWith the angle convention above, the upper tangent point is at . Its plane therefore makes with the maximum-compression direction; there is a conjugate plane on the other side. For , this is , rather than the plane of maximum shear stress. An existing weak fault can reactivate first, with its own lower cohesion and friction, and need not have this optimum new-fracture orientation.
For tensile brittle fracture, add a tensile strength cutoff: failure occurs when , where . The opening fracture is approximately perpendicular to the minimum-compression direction. Real rock envelopes curve, especially at small confinement; a straight shear envelope must not be extrapolated as an exact tensile law. High confinement can instead favor distributed or ductile deformation, so merely drawing a larger circle does not establish that brittle failure is the active mechanism.[ref]
Stress and strength lecture notes by MIT OpenCourseWare. Lecture 10, frictional strength and Mohr construction; the tensile cutoff is a separate condition.
Pore fluid pressure reduces the compressive load carried across grain contacts or an accessible fault. In the usual elementary approximation,At fixed total stress, increasing translates the entire Mohr circle left by without changing its radius or the differential stress. The circle therefore approaches the frictional failure envelope even though the applied shear has not increased. Equivalently, in total-stress coordinates the strength on an existing plane is , reduced by . For a known orientation and constant frictional parameters, the ideal critical pressure isprovided the plane is in contact and sliding failure is reached before tensile opening.
For the diagram's illustrative , , and , the dry circle is below failure. The freely oriented tangency threshold is about ; the circle is already beyond that threshold and shows the loading tendency, not a stable post-failure state. If grows enough that , fluid pressure can instead open a tensile fracture. A porous-continuum effective stress law may use with a coefficient different from one. Also, changing fluid pressure can change total stress through constrained deformation; pure horizontal translation assumes those total stresses remain fixed.[ref]
Stress and strength lecture notes by MIT OpenCourseWare. Lecture 10, frictional strength modified by pore-fluid pressure.
Fault slip must taper toward zero at the tips of an isolated finite fault, because its two sides are still joined beyond the tips. Accumulating more central displacement at a fixed short length steepens the displacement gradient and loads the surrounding rock, especially near the tips. In a simple elastic scaling, a fault of length and characteristic displacement requires a characteristic driving shear stress of orderwhere is the shear modulus and the omitted coefficient depends on fault geometry. The host's finite strength prevents this gradient increasing indefinitely. Tip damage, new cracking and linkage with neighboring segments allow the fault system to lengthen and accommodate more displacement without unbounded tip loading. Self-similar growth at roughly comparable driving stress consequently gives the approximate fault displacement-length scaling ; displacement also commonly increases toward the interior of a fault segment.[ref]
Fault displacement-length scaling by United States Geological Survey. 2008 study, abstract: approximately linear scaling for shearing discontinuities under constant driving stress, with near-tip stress limited by rock strength.
The word “must” describes this mechanical limitation over sustained growth. It is not a rule that every earthquake or every increment of accumulated fault slip lengthens the mapped trace: strong barriers, interactions and early establishment of fault length can permit substantial later displacement at nearly constant length.
A blind reverse fault can transfer displacement into folding above its buried tip. Look for an asymmetric growing anticline, often with a steep forelimb and gentler backlimb, aligned with the inferred fault strike. A fault-propagation fold is one possible geometry; the fold alone does not uniquely establish the fault's depth or shape. Exposed older geological strata may be more steeply tilted than younger deposits, while growth strata thin and onlap toward an uplifting crest or fan in dip as deformation accumulates. Progressive unconformities and warped young deposits help distinguish active folding from an inherited fold.
In the landscape, seek an elongate uplifted ridge, warped or tilted river terraces and alluvial fans, localized fold scarps, incision across the rising structure, and drainage deflection or abandoned channels. Compare landforms of known relative ages: increasing deformation with age records repeated motion. Opposite fold limbs may show contrasting uplift and tilting, while active axial surfaces can concentrate deformation into narrow belts even without the main fault reaching the surface. Combine geological mapping and dating with seismic reflection or evidence from geodesy where available; an erosional ridge alone is not proof of a buried active reverse fault.[ref]
Interferometric synthetic-aperture radar compares the phase of coherent radar returns acquired before and after the earthquake from closely repeated viewing geometry. After image registration and removal of orbital and topographic phase, the residual interferometric phase constrains relative ground displacement along the radar line of sight. Defining positive toward the satellite and choosing the interferogram's phase order accordingly,One complete colour cycle therefore represents of relative line-of-sight displacement. Reversing the image order reverses the displayed phase sign. This observes a projection of both horizontal and vertical motion, not uplift alone.[ref]
Interferometry by NASA. NISAR mission explanation: remove orbit/topography contributions and interpret each complete fringe as half a radar wavelength of line-of-sight range change.
Qualitative interferograms for surface-breaking and blind reverse rupture
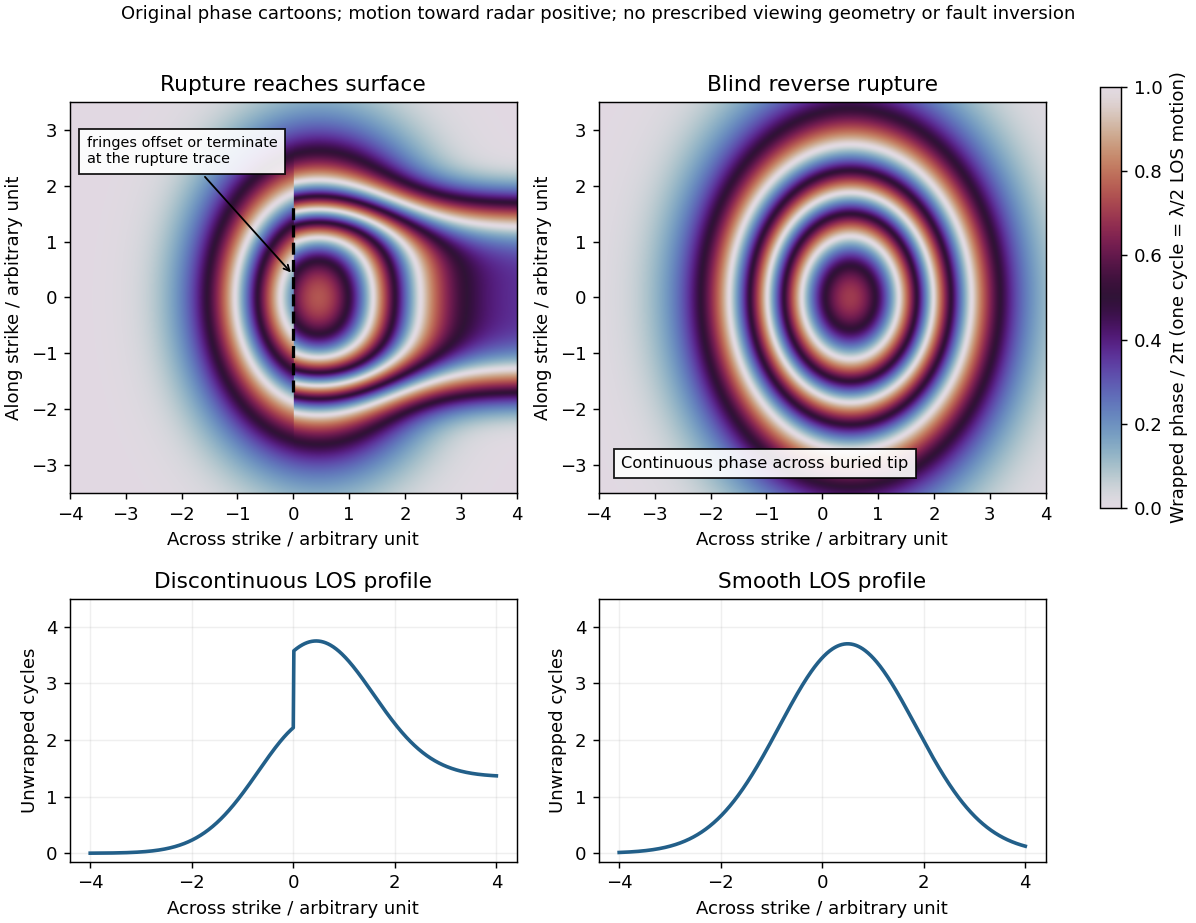
. Original wrapped-phase cartoons and corresponding unwrapped line profiles. They illustrate a displacement discontinuity versus a continuous deformation lobe, rather than numerical elastic fault models. The chosen phase sign is positive toward the radar. Every complete colour cycle represents half a radar wavelength of line-of-sight displacement; real fringe shape depends on viewing and rupture geometry. Details.
If the main reverse rupture reaches the surface, coherent areas on opposite sides can show a displacement step: fringes become offset, truncated or abruptly juxtaposed along a trace. A narrow belt can lose interferometric coherence where cracking, intense gradients or changed scatterers prevent reliable phase comparison. If the rupture remains blind, a simple elastic model instead predicts a continuous surface displacement field, often a broad asymmetric lobe with continuous curved or closed fringes and a smooth displacement gradient across the projected tip.
These are diagnostic tendencies, not a unique test. An ordinary wrapped-phase boundary is just a colour reset and is not itself a rupture. A step of an integer number of cycles can be hidden in wrapped phase; loss of interferometric coherence can hide either kind of near-field deformation. Vegetation, atmosphere and viewing direction also affect the pattern, and a displacement perpendicular to the radar line of sight is poorly sensed. Inspect coherence and unwrapped displacement, compare ascending and descending views where possible, and test a fault model against field observations. A sharp fold scarp above a blind rupture or a secondary shallow fault can also create localized gradients, so smooth fringes do not prove a buried tip and broken fringes alone do not prove a surface-breaking main rupture.
For a surface-breaking reverse earthquake, expect a fault scarp or disrupted belt with the hanging wall displaced upward and commonly over the footwall. Small thrust faults, splays and backthrusts may repeat or override shallow deposits. Shortened soil, roads or other markers may buckle, while soft sediment can form pressure ridges and compression folds. Near the scarp, gravitational collapse and local bending can also produce tensile fissures and small normal faults; a reverse event need not create compression everywhere at the surface.
For a blind reverse rupture, expect coherent uplift and warping, newly tilted surfaces, or a fold scarp without a throughgoing primary fault offset. Small flexural-slip surfaces along bedding, secondary thrust faults or backthrusts, and opening cracks or small normal faults over the bent outer arc of the anticline can accompany the folding. Deformation may be distributed or localized at fold hinges. Thus a blind main fault does not imply an entirely unbroken ground surface, and secondary cracking must be distinguished from the principal rupture by its geometry and displacement pattern. Shaking-triggered landslides or soil liquefaction can accompany either case and should not automatically be mapped as primary tectonic rupture.[ref]
Blind-thrust mapping report by United States Geological Survey. Active fold scarps can arise through localized coseismic uplift and tilting without the principal thrust reaching the ground surface.
A Sun-synchronous orbit maintains approximately constant orientation relative to the mean Sun, so corresponding passes over a location occur at nearly the same local solar time. It is usually a nearly polar, slightly retrograde low Earth orbit. Earth rotates beneath the successive tracks, allowing broad coverage; the satellite is not stationary over a location and does not necessarily revisit that location every day.
It is attained by selecting altitude, orbital eccentricity and orbital inclination so that nodal precession caused by Earth's equatorial bulge matches the mean apparent annual motion of the Sun, about per year eastward. To leading order,Here is the semi-major axis, the orbital eccentricity, the orbital inclination, the mean motion, and Earth's dimensionless quadrupole coefficient. A retrograde inclination has , giving the required positive precession; typical imaging altitudes yield inclinations around –. The launch establishes the required orbital plane, and subsequent orbit maintenance limits drift.
This geometry suits repeated optical and multispectral imaging of land, vegetation and oceans, because comparable local time reduces illumination and shadow differences. Landsat and Sentinel-2 are examples. Radar missions such as Sentinel-1 also use this orbit for regular global sampling even though their illumination is supplied by the radar. Constant local time helps comparison but does not remove seasonal changes in solar elevation.[ref]
Catalog of Earth satellite orbits by NASA Earth Observatory. “Polar Orbits” and “Sun-Synchronous Orbits”: near-polar global sampling and controlled precession maintaining local solar time.
A geostationary orbit is a circular, prograde, equatorial orbit with period equal to one sidereal day, approximately . Its satellite therefore remains above one longitude on the equator. Merely having a one-day period gives a geosynchronous orbit; an inclined or eccentric version still moves across the ground observer's sky.
Balancing gravitational acceleration and centripetal acceleration givesOne route is injection into an elliptical geostationary transfer orbit, followed by a burn near apogee to circularize and remove the remaining inclination; direct or low-thrust transfers are also possible. Subsequent station keeping controls longitude, inclination and eccentricity.
The fixed wide view permits frequent observations of weather, clouds and rapidly changing storms, as in Meteosat and GOES. The tradeoffs are large range, generally coarser spatial sampling for comparable optics, oblique views at high latitudes and poor polar coverage. It is valuable for following change through the day rather than obtaining global coverage with one spacecraft.[ref]
Catalog of Earth satellite orbits by NASA Earth Observatory. “High Earth Orbit”: geosynchronous radius, the circular/equatorial conditions for geostationarity, and weather-monitoring applications.
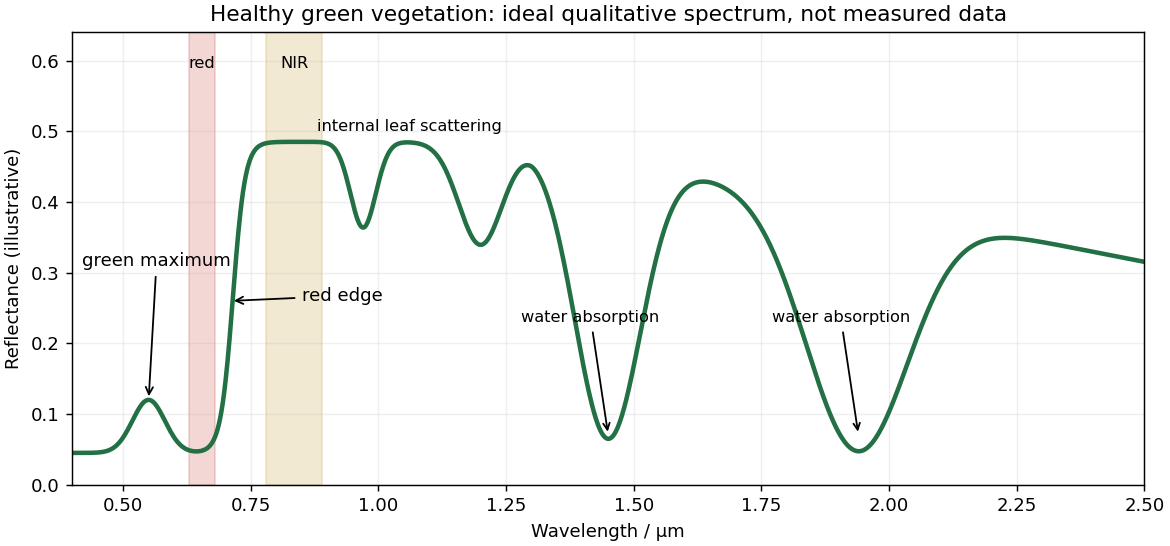
Healthy green vegetation has strong visible absorption in the blue, around –, and red, around –, mainly from chlorophylls and other photosynthetic pigments. Weaker absorption around green wavelengths produces a relative reflectance maximum near and the familiar green appearance. The red edge is the steep reflectance rise around –. In the near-infrared, weak pigment absorption and multiple scattering at internal leaf tissue–air interfaces produce high reflectance, commonly a broad plateau. This plateau is primarily a structural scattering effect, rather than chlorophyll reflecting the light.[ref]
Measuring vegetation by NASA Earth Observatory. “Normalized Difference Vegetation Index”: contrast between chlorophyll absorption of visible light and strong near-infrared scattering by leaf structure.
Qualitative reflectance spectrum of healthy green vegetation
. Original synthetic leaf spectrum with a green maximum, red absorption, red edge, near-infrared plateau and shortwave-infrared water absorption troughs. The curve is illustrative rather than measured; shaded bands exemplify red and near-infrared measurements for a vegetation index. Details.
Leaf water produces absorption troughs in the shortwave infrared, especially near and , with weaker features near and . Atmospheric water vapor also strongly absorbs near and , so satellite bands usually avoid the centres of those deep troughs. Drying, senescence, pigment loss and changes in canopy structure alter the spectrum; measured canopy reflectance also includes shadows and the soil background.
To highlight vegetation, assign the near-infrared band to the red display channel, red to green and green to blue: vigorously vegetated areas appear bright red in this conventional false-colour composite. Alternatively calculate the normalized difference vegetation index from atmospherically corrected, spatially registered red and near-infrared reflectances:Large positive values indicate a strong vegetation-like red/NIR contrast. For example, and give about . Mask clouds, their shadows and invalid low-signal pixels. Bare soil usually has a smaller contrast, while water often has negative values; fixed universal thresholds are inappropriate, and dense vegetation can saturate the index. A band ratio improves contrast but is not a direct count of plants or a unique measure of physiological health.[ref]
Measuring vegetation by NASA Earth Observatory. “Normalized Difference Vegetation Index”: normalized red/near-infrared contrast and interpretation of green vegetation.
The principal non-water visible-light absorbers can be grouped into phytoplankton pigments, coloured dissolved organic matter (CDOM), and non-algal particles (NAP), including organic detritus and absorbing mineral material. A useful additive decomposition of the absorption coefficient isThe supplied sketch separates the three non-water contributions; its amplitudes are arbitrary and are not concentrations or measured spectra.
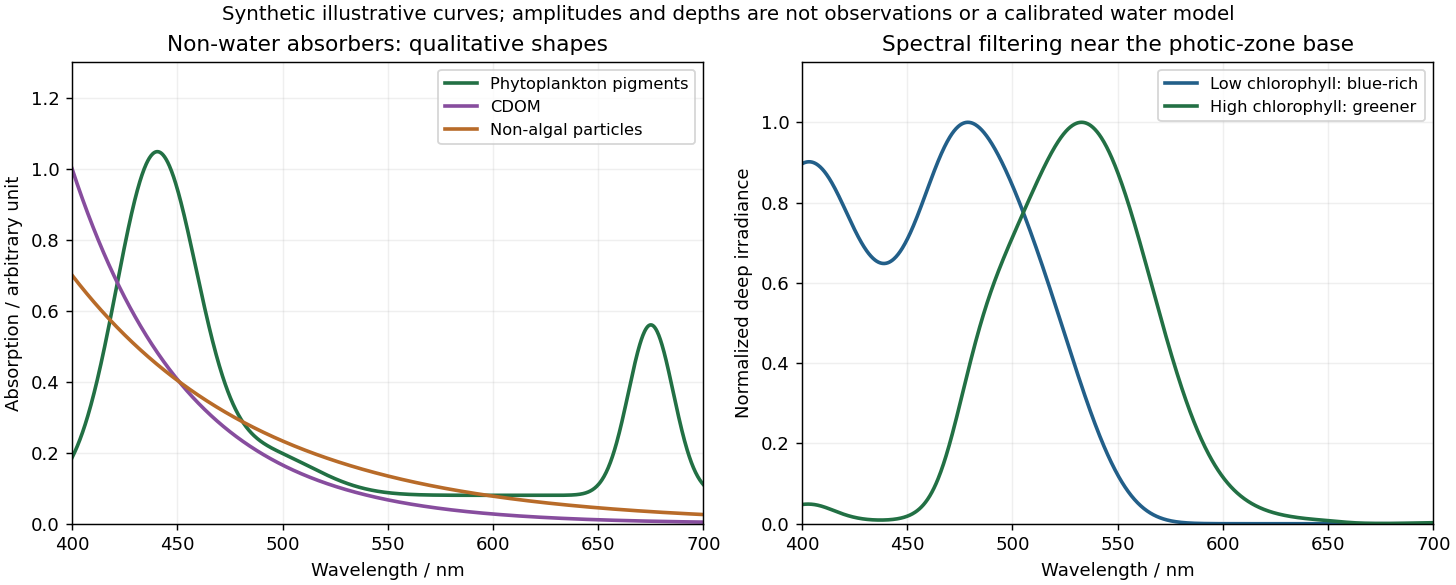
Qualitative marine absorption spectra and deep-light spectral filtering
. Original synthetic sketches: phytoplankton have blue and red pigment absorption bands, while CDOM and non-algal particles preferentially absorb short wavelengths. The right panel illustrates blue-rich deep light in low-chlorophyll clear water and a greener spectrum in more absorbing high-chlorophyll water. Spectra are normalized separately; curves and representative depths are illustrative, not observations or a calibrated radiative-transfer calculation. Details.
Phytoplankton pigments give prominent absorption maxima around and , associated with chlorophyll a, and a relative minimum in the green. Accessory pigments, including carotenoids and phycobilins, broaden or add absorption bands, so an assemblage is not just a pure chlorophyll-a solution. Intracellular packaging and cell size also modify the shape and absorption per unit pigment.
Coloured dissolved organic matter consists of dissolved light-absorbing organic compounds, often including humic material from terrestrial runoff and marine degradation. Its absorption is strongest at the blue/ultraviolet end and declines approximately exponentially toward red, without the narrow chlorophyll red peak. A common local parameterization is with positive spectral slope ; here is an optical slope, not gas saturation.
Non-algal particles include nonliving organic detritus, pigment degradation products and absorbing suspended mineral particles. Their aggregate absorption often also decreases approximately exponentially from blue to red, with variable slope and mineral-dependent departures. Suspended sediments can strongly scatter as well as absorb; bright sediment-laden water is not evidence of a red absorption peak. Chlorophyll-containing living cells belong in , so these categories should not be double counted.[ref]
Ocean optics protocols by NASA. Revision 4, Volume I, sections defining chlorophyll, CDOM and non-pigmented-particle absorption, and the importance of blue absorption to ocean-colour retrieval.
Many open-ocean chlorophyll retrieval algorithms infer chlorophyll a from the blue-to-green remote-sensing reflectance ratio. Increasing pigment generally depresses blue reflectance relative to green. In coastal waters, however, coloured dissolved organic matter and non-algal particles can independently absorb blue light, as in the sketches, and therefore mimic an increase in pigment. Their concentrations need not covary with phytoplankton biomass: river runoff and sediment resuspension can change them separately.
Moreover, the satellite measures emerging radiance, not absorption directly. Schematically,where is the backscattering coefficient; this is an explanatory approximation, not a complete retrieval formula. Suspended particles change both absorption and backscattering, and different mixtures can produce similar band ratios. Shallow-bottom reflection, land-adjacency effects and more difficult atmospheric correction introduce further coastal errors. Consequently a simple blue/green ratio can overestimate chlorophyll a when excess CDOM removes blue light, although sediment scattering and other effects mean the bias is not universally positive. Multiband or hyperspectral methods that separately constrain pigment, dissolved absorption and particles, supported by local observations, are preferable in optically complex water.[ref]
Ocean optics protocols by NASA. Revision 4, Volume I: unaccounted blue absorption by CDOM creates regional chlorophyll-retrieval uncertainty; absorption and scattering are distinct optical properties.
Chlorophyll a occurs in nearly all oxygen-producing phytoplankton groups and is central to their photosynthesis. Its concentration can be measured reproducibly by pigment extraction or calibrated optical methods, and its absorption affects ocean colour, making it observable over large areas. It is therefore a practical common index of photosynthetic standing stock across diverse communities, unlike a pigment limited to one group.
It is a proxy, not a fixed conversion to phytoplankton biomass or primary production. The carbon-to-chlorophyll ratio varies with species, light acclimation, nutrient supply and physiological condition; low-light cells often contain more pigment per unit carbon. Dead pigment and methodological differences can also affect interpretation, and nonphotosynthetic plankton are not represented. A pigment increase need not mean the same proportional increase in living carbon biomass.[ref]
Chlorophyll maps by NASA Earth Observatory. Chlorophyll alters sunlight absorption and reflection, enabling mapping of near-surface phytoplankton distributions; pigment is used as an index rather than a direct carbon measurement.
The photic zone is the illuminated layer supporting photosynthesis; its euphotic depth is conventionally associated with about 1% of surface photosynthetically active radiation, integrated over approximately –. This is a useful convention rather than a universal organism-specific compensation depth. Spectral filtering can be represented locally bywhere is the wavelength-dependent diffuse attenuation coefficient. It includes effects of absorption and scattering and is not simply equal to the absorption coefficient .
In clear, low-chlorophyll water, pure water removes red light strongly, while weak blue pigment and CDOM absorption permits blue light, typically around –, to penetrate furthest. The deepest usable light is consequently dim and blue-rich, and the euphotic zone can extend relatively deep. At high pigment concentrations, phytoplankton pigments preferentially remove blue and red light; associated detritus or CDOM can remove still more blue. The remaining transmission window commonly shifts toward blue-green or green wavelengths, roughly –, and the total light falls off faster, so the euphotic depth is shallower. Exact window and depth depend on the full particle/dissolved mixture, not chlorophyll alone. The diagram normalizes the two deep spectra separately to show their different shapes, not equal absolute light at a common depth.
This confines photosynthetic growth to a thinner illuminated interval in high-chlorophyll water and allows a deeper potential habitat in clear low-chlorophyll water, subject also to nutrient supply, mixing and the organism's compensation requirement. Cells near the base benefit from low-light acclimation and pigment systems that capture the remaining wavelengths. In blue-rich deep ocean water, blue-absorbing pigments and some low-light-adapted picoplankton can be favored; where the surviving light is greener, groups with effective green-absorbing accessory pigments, such as certain phycobilins, gain an advantage. A pigment appears coloured by light it fails to absorb, so green-absorbing accessory pigments need not themselves look green. There is no universal deep species determined by chlorophyll concentration alone. A deep chlorophyll maximum can partly reflect increased pigment per cell rather than a proportional maximum in carbon biomass.[ref]
Phytopia's light and color by NASA. Photic-zone discussion: the 1% convention, deep penetration in clear blue waters, and shallower illuminated habitat in productive turbid waters; pigment-based community selection here follows the surviving wavelengths and is conditional.
Assume sufficient decay and differentiability to justify integration by parts and exchange of integrals; Schwartz functions are one convenient class. With the stated Fourier transform convention, integrate first in :The boundary contribution vanishes under the decay assumption. The Fourier transform of a derivative consequently turns constant-coefficient spatial differential operators into multipliers. Repeating it gives , so the heat equation becomes an independent temporal ordinary differential equation at each wavevector.
Apply the Fourier transform of a derivative twice in each spatial coordinate, and commute the time derivative with the spatial Fourier transform. For the Laplacian,ThusThe minus sign is essential: positive thermal diffusivity damps short spatial scales rather than amplifying them. The zero Fourier mode is unchanged in the absence of a source.
Let be the Fourier transform of the initial temperature. Solving the scalar linear ordinary differential equation givesRecover using the Fourier inversion theorem, with inverse factor for this two-dimensional convention. Equivalently, take the convolution of the initial data with the two-dimensional heat kernel. On a periodic square, the same exponential applies to each discrete Fourier mode, with and .
- Constant thermal diffusivity makes the Fourier spectral method diagonal: each Fourier mode can be evolved by its exact exponential multiplier.
- The smooth initial Gaussian function has rapidly decaying Fourier coefficients, so a moderate grid resolves it well. The Fast Fourier transform provides an efficient change between the spatial grid and those coefficients.
- A discrete Fourier transform describes a periodically repeated array. Opposite edges are identified by periodic boundary conditions; this is a periodically continued plate model, rather than a plate with prescribed cold or insulated edges.
- The initial hot spot is far from those edges. Over the stated short interval its width remains much smaller than the side length, so the periodic images have negligible influence near the centre. At sufficiently long times, periodic diffusion tends to the conserved spatial mean.
For consistency with the supplied wavenumbers, use an FFT grid on a periodic interval: , , and similarly for . In MATLAB, replace the endpoint-inclusive coordinate definitions by
x = (0:nx-1)*Lx/nx; and y = (0:ny-1)*Ly/ny;. The supplied linspace arrays instead have spacing while the Fourier multipliers assume . Including both copies of the periodic endpoint creates a grid inconsistency, separate from high-frequency aliasing.- Lines 1–7 set the grid dimensions, domain lengths, thermal diffusivity and time interval. The elapsed time is .
- Lines 9–10 supply coordinates, subject to the periodic-grid correction above. Lines 16–17 sample the initial Gaussian function.
- Lines 11–14 construct the discrete Fourier transform frequency order and . Negative frequencies occupy the second half of each array. This is the discrete version of replacing each spatial derivative by multiplication by .
- Line 20 computes the two-dimensional Fast Fourier transform. Lines 22–24 multiply every mode by at every step, implementing the modal solution derived above.
- Line 26 performs the inverse discrete Fourier transform. Taking the real part removes tiny imaginary roundoff errors; conjugate symmetry of the exact transformed real data already guarantees a real result.
- Lines 28–42 display the initial and final arrays. A common colour scale is needed to compare their peak temperatures; independent automatic colour scales can hide the decrease in amplitude.
For this linear homogeneous problem, the exponential update is exact for the retained modes, apart from roundoff error. It is not a forward Euler method step and does not require the explicit finite-difference diffusion stability restriction. Sampling, periodic modelling and spatial resolution still matter.
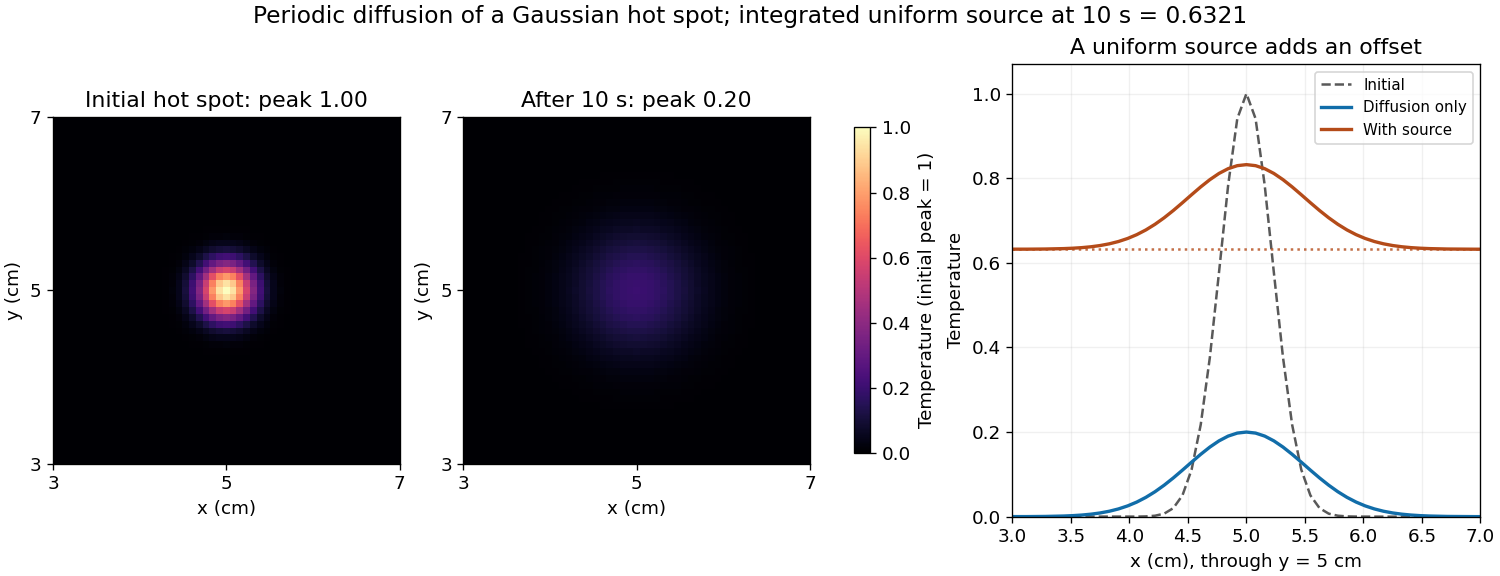
Diffusion smooths and broadens the hot spot while conserving its integral. For an isolated two-dimensional initial profile , the Gaussian hot spot under diffusion isHere and , giving a width parameter of and a peak of in the initial temperature units. The periodic-grid calculation agrees to displayed precision because the periodic copies are far away. Running the endpoint-inclusive listing as written instead gives a sampled initial peak near and final peak near ; the difference is consistent with the coordinate-grid issue, rather than a different diffusion law.
Increasing positive thermal diffusivity at fixed time produces a wider, lower peak. Each nonconstant Fourier mode decays faster, while the spatial mean of a periodic heat equation remains fixed. The profiles approach a uniform mean at long times under these periodic boundary conditions.

Aliasing occurs because a sampled grid cannot distinguish certain different continuous Fourier modes. With spacing , modes and agree at every sample point. Frequencies above the Nyquist frequency can therefore be misidentified as lower frequencies, changing the resolved spectrum and its subsequent diffusion rate.
For the corrected grid, and the maximum resolved angular wavenumber is approximately . The initial Gaussian function has spectral envelope proportional to . At that one-coordinate cutoff the factor is about , so the omitted high-frequency tail is tiny. Its continuation mismatch at the distant edges is also tiny. Significant aliasing is not expected for this resolved, smooth initial condition.
The linear constant-coefficient heat equation only damps existing modes; it does not generate higher frequencies through nonlinear products. An unresolved narrow peak, a sharp edge or a nonlinear source would require a separate resolution assessment. The duplicated-endpoint grid issue described above should not be diagnosed as high-frequency folding.
A spatially uniform source changes only the zero Fourier mode. Its exact integrated increment over a time step beginning at isThe unnormalised two-dimensional discrete Fourier transform stores a constant field as in element This replacement uses the original variable names and MATLAB indexing. The uniform forcing of a periodic heat equation is integrated exactly in time here. No source multiplier is applied to the other modes, and the zero-mode homogeneous multiplier equals one. Adding only
(1,1).[ref]fft2 documentation by MathWorks. The forward defining sum has no normalization; the linked inverse definition includes the factor .
Keep the existing homogeneous exponential multiplication and add this source increment to that element:for i = 1:nt
t = (i-1)*dt;
u_hat = u_hat .* exp(-alpha*K2*dt);
dq = exp(-t/10) - exp(-(t+dt)/10);
u_hat(1,1) = u_hat(1,1) + nx*ny*dq;
enddq to the unnormalised coefficient would underestimate the physical temperature increment by the factor .The uniform source adds a background without changing the spatial gradients relative to the unforced solution:At the offset is . On the corrected grid the central peak is therefore about , and regions far from the hot spot are near . The hot spot's broadening is unchanged; the source is spatially uniform. The spatial mean of a periodic heat equation rises by the same amount, tending to a total increment of one temperature unit as .
Since tension is a force and is a linear mass density,Thus has units . It is the transverse wave speed of the ideal uniform string. The wave equation on a string assumes small transverse slopes, constant positive tension, positive uniform linear mass density, and negligible damping and bending stiffness.
The wave equation is second order in time. Even one normal mode obeys a second-order ordinary differential equation, so its initial displacement and initial velocity are independent data. Physically they specify stored elastic deformation and the initial motion.
The heat equation is first order in time; its initial temperature already fixes the instantaneous time derivative through the spatial Laplacian. It needs one initial field. In either case spatial boundary conditions remain necessary and are not substitutes for initial data. Classical fixed-end string data must satisfy the appropriate endpoint compatibility, including and, when endpoint velocities exist, .
Use separation of variables with a nontrivial product . Substitution into the wave equation on a string gives . Wherever the factors are nonzero,The left side depends only on and the right only on , so both are a constant. For nontrivial fixed-end solutions this constant is negative: multiplying by and integrating, using the homogeneous Dirichlet boundary conditions, givesWrite it as . The separated equations are thereforeThese equations extend across the zeros of and ; the division is a derivation device, not a restriction excluding their nodes.
For , the harmonic oscillator equation gives . The condition at zero requires , and the condition at requires . A nonzero normal mode therefore hasA multiplicative normalization has been absorbed into the temporal amplitude. The candidate is affine and the two zero endpoint values force it to vanish. A positive separation constant gives hyperbolic functions, whose two zero endpoint values likewise give only the trivial solution. Negative adds no new eigenfunctions because it only reverses their signs.
For each spatial normal mode, the temporal equation is , with angular frequency . HenceThe ordinary frequency is ; it should not be confused with the angular frequency used in the sine and cosine arguments.
The wave equation and its homogeneous Dirichlet boundary conditions are linear, so any finite linear combination of the separated normal modes is another solution. More strongly, the Fourier sine basis is complete in L2 space on . Expanding the initial fields in this basis yieldsCompleteness of the Fourier sine basis is the reason the expansion covers general data; linearity alone would not prove that every solution has this form. The convergence and differentiation are understood in a function space appropriate to the data. For finite wave energy, one can take and , obtaining an energy solution; stronger smoothness and endpoint compatibility give a classical solution.
At , the displacement expansion is . Fourier orthogonality givesDifferentiating the modal solution at zero gives , soThe factor is required because the derivative of at zero is . The dimensions agree: and are displacements, while the sine coefficients of are velocities. These projections also establish uniqueness within the finite-energy solution class.
At the one-bar standard state, pure mineral endmembers and water vapour treated as an ideal gas all have unit thermodynamic activity. The Gibbs energy of reaction is . Setting it to zero givesThe quantities are taken per mole of the reaction as written. The simplified result uses the stipulated temperature-independent enthalpy and entropy differences.
Articles were limited to the first 100 out of 586 total.
Articles by others on the same topic
There are currently no matching articles.