For the sketches, take to multiply the annual component and the daily component. Their amplitudes are left as parameters, as in the model.
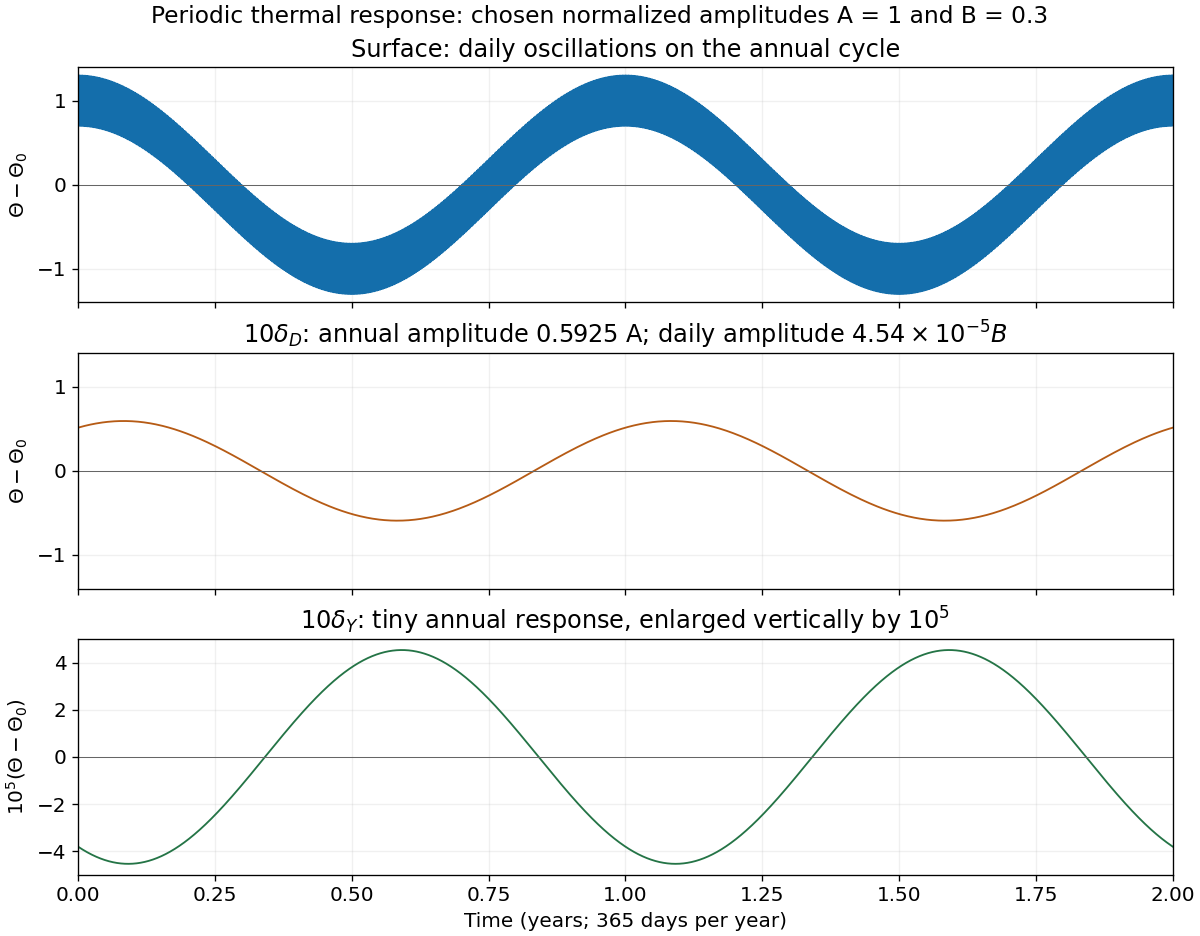
At the surface both attenuation factors are one and both lags vanish:The sketch is a rapid daily oscillation on a slowly varying annual background. The amplitudes cannot be inferred uniquely from the sampling intervals alone.
At , the daily component is multiplied by and has a lag of ten radians. The annual component instead has . HenceThe sketch is nearly a smooth annual sinusoid, with annual amplitude about and annual phase lag about radians, corresponding to about days on the chosen year scale. The tiny daily component is retained in the formula rather than declared identically zero.
At , the annual attenuation is and the daily attenuation is , approximately . ThusOn the same vertical scale as the surface plot this is almost the constant . With a sufficiently enlarged scale, a residual annual oscillation of amplitude remains. Its phase lag is ten radians, interpreted modulo when comparing periodic maxima.

Articles by others on the same topic
There are currently no matching articles.