A sugarcane harvester is a specialized agricultural machine designed to efficiently harvest sugarcane crops. These machines have been developed to streamline the harvesting process, which traditionally required significant manual labor. ### Key Features of Sugarcane Harvesters: 1. **Cutting Mechanism**: Sugarcane harvesters are equipped with large cutting blades or knives that can quickly cut the tall stalks of sugarcane close to the ground.
The title of Fellow of the Institution of Mechanical Engineers (FIMechE) is one of the highest levels of membership within the Institution of Mechanical Engineers (IMechE), a professional engineering institution based in the United Kingdom. It recognizes individuals who have demonstrated significant professional achievement and leadership in the field of mechanical engineering.
A variator, commonly found in the context of mechanical systems, refers to a type of continuously variable transmission (CVT) that allows for the seamless adjustment of output speed and torque in response to changing load conditions. Variators are commonly used in applications like scooters, some bicycles, and industrial machinery. The main feature of a variator is its ability to change the gear ratio continuously without the discrete steps found in traditional gear systems.
A wire race bearing is a type of bearing that utilizes thin wire rings as raceways for rolling elements, usually balls or rollers. Unlike traditional bearings that have thick, solid rings, wire race bearings use these thin wire rings to provide a lightweight and compact solution for supporting and allowing relative movement between two parts. ### Key Features of Wire Race Bearings: 1. **Design**: They feature two or more wire rings that act as raceways.
Wuest-type herringbone gears are a specific design of herringbone gears that are used to transmit power and motion between non-parallel shafts. Herringbone gears, in general, are characterized by their V-shaped tooth design that allows for smooth and quiet operation, as well as the ability to handle high loads. The Wuest design incorporates two helical tooth systems that are placed in a specific arrangement to effectively manage thrust loads, which are generated when gears mesh.
The Fellows of the American Society of Mechanical Engineers (ASME) is a prestigious honor awarded to individuals who have made significant contributions to the field of mechanical engineering and have demonstrated excellence in their professional practice or research. The title of Fellow recognizes the achievements and leadership of members of ASME who have advanced the profession and have provided service to ASME and their communities.
Armais Arutunoff was a prominent Russian-American engineer and inventor who is best known for his contributions to the field of marine hydraulics, specifically in the development of hydraulic systems for use in naval applications. He played a significant role in the design and implementation of innovative hydraulic systems that were used in naval vessels and submarines. In addition to his engineering work, Arutunoff is also recognized for his contributions to the field of underwater exploration and robotics.
Mechanical failure modes refer to the various ways in which materials or components can fail due to mechanical stresses or external forces. Understanding these failure modes is crucial in engineering and design, as it helps in predicting potential points of failure, improving safety, and enhancing the reliability of structures and systems. Here are some common mechanical failure modes: 1. **Tensile Failure**: Occurs when a material is subjected to a tensile load greater than its tensile strength, leading to necking and eventual fracture.
Mieczysław G. Bekker was a notable figure in the fields of mechanical engineering and robotics. He is best known for his contributions to the development of autonomous vehicles and mobile robotics. Bekker made significant advancements in understanding vehicle dynamics and terrain interaction, which laid the groundwork for future research in robotics and autonomous systems. His work has had implications in various applications, including space exploration and ground vehicle design.
The iPhone 6 is a smartphone designed and marketed by Apple Inc. It was announced on September 9, 2014, and released on September 19, 2014. The iPhone 6 is part of the eighth generation of the iPhone and features a larger display compared to its predecessor, the iPhone 5S. **Key specifications and features of the iPhone 6 include:** 1. **Display**: It has a 4.
A bayonet mount is a type of camera lens attachment system that allows for quick and secure mounting and dismounting of lenses to a camera body. This system typically involves a set of lugs and a locking mechanism, which enable the lens to be rotated and locked into place on the camera body. Bayonet mounts are commonly used in various camera systems, including DSLRs, mirrorless cameras, and some medium and large format cameras.
DSP coupling refers to the interaction between different digital signal processing (DSP) components or systems. It typically describes how different DSP algorithms, systems, or technologies influence each other's behavior, performance, or output in a given application. In digital signal processing, coupling can take various forms: 1. **Direct Coupling**: This occurs when the output of one DSP component directly affects the input of another.
A hose clamp is a fastening device used to secure a hose onto a fitting, such as a pipe or a barb. It is commonly made of metal but can also be made from plastic or other materials. Hose clamps are widely used in various applications, including automotive, plumbing, and industrial settings, to prevent leaks at connections between hoses and fittings.
In music, "organs" refer to a family of musical instruments that produce sound by forcing air through pipes or by other means, such as electronic generation. There are several types of organs: 1. **Pipe Organ**: This is the classic form of organ, traditionally found in churches and concert halls. It consists of a series of pipes of various lengths and materials that produce different pitches when air is blown through them.
The Apollonicon is a unique musical instrument designed to replicate the sound of the ancient Greek instrument known as the aulos. It was created by the musician and composer Christine Southworth. The instrument is notable for its historical and artistic significance, as well as its engineering design, which incorporates various elements to produce its distinctive sound. The Apollonicon integrates both traditional and modern technologies, allowing musicians to create a wide range of sounds and musical expressions.
A barrel piano, also known as a barrel organ or hand-cranked music box, is a type of mechanical musical instrument that plays music automatically. It typically consists of a cylindrical barrel with a series of pins or pins that strike tuned metal plates or bells when the barrel is turned or cranked. The barrel is often made of wood and is mounted on a frame that may include a mechanism for turning the barrel, which can be operated manually or by a pedal.
A 19-inch rack is a standardized framework used for housing electronic equipment, particularly in data centers, server rooms, and telecommunications environments. The term "19-inch" refers to the width of the rack's internal mounting space, which is 19 inches (approximately 48.26 cm) between the internal mounting rails. This standard allows equipment such as servers, networking devices, and other hardware to be easily installed and removed.
Pinned article: Introduction to the OurBigBook Project
Welcome to the OurBigBook Project! Our goal is to create the perfect publishing platform for STEM subjects, and get university-level students to write the best free STEM tutorials ever.
Everyone is welcome to create an account and play with the site: ourbigbook.com/go/register. We belive that students themselves can write amazing tutorials, but teachers are welcome too. You can write about anything you want, it doesn't have to be STEM or even educational. Silly test content is very welcome and you won't be penalized in any way. Just keep it legal!
Intro to OurBigBook
. Source. We have two killer features:
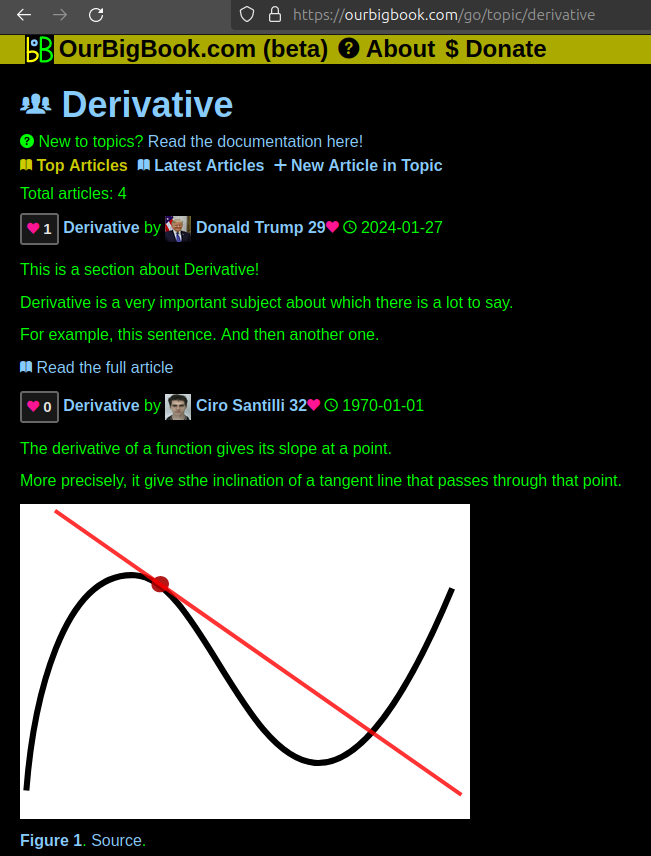
- topics: topics group articles by different users with the same title, e.g. here is the topic for the "Fundamental Theorem of Calculus" ourbigbook.com/go/topic/fundamental-theorem-of-calculusArticles of different users are sorted by upvote within each article page. This feature is a bit like:
- a Wikipedia where each user can have their own version of each article
- a Q&A website like Stack Overflow, where multiple people can give their views on a given topic, and the best ones are sorted by upvote. Except you don't need to wait for someone to ask first, and any topic goes, no matter how narrow or broad
This feature makes it possible for readers to find better explanations of any topic created by other writers. And it allows writers to create an explanation in a place that readers might actually find it.Figure 1. Screenshot of the "Derivative" topic page. View it live at: ourbigbook.com/go/topic/derivativeVideo 2. OurBigBook Web topics demo. Source. - local editing: you can store all your personal knowledge base content locally in a plaintext markup format that can be edited locally and published either:This way you can be sure that even if OurBigBook.com were to go down one day (which we have no plans to do as it is quite cheap to host!), your content will still be perfectly readable as a static site.
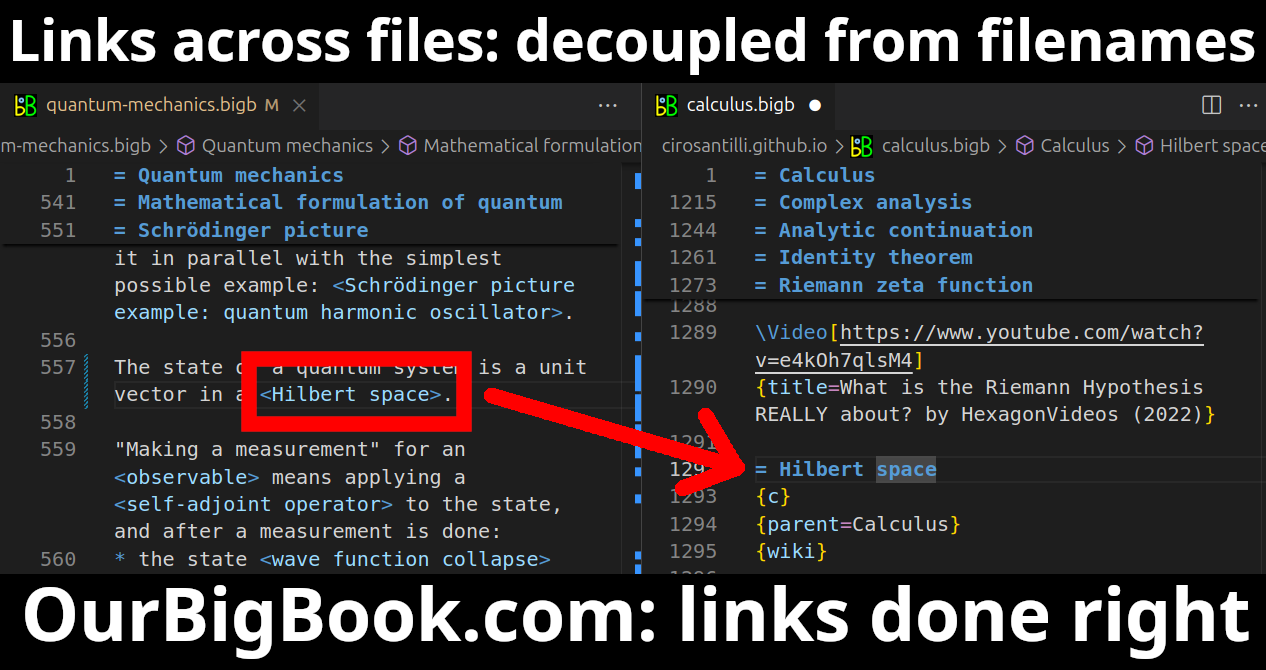
- to OurBigBook.com to get awesome multi-user features like topics and likes
- as HTML files to a static website, which you can host yourself for free on many external providers like GitHub Pages, and remain in full control
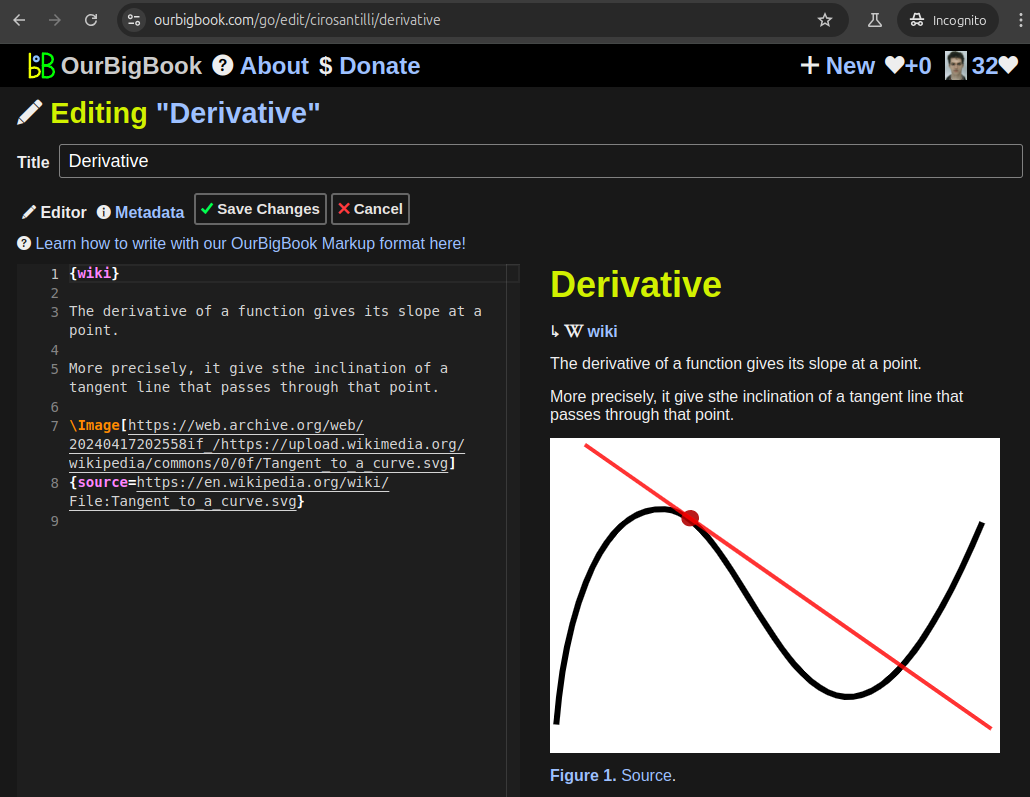
Figure 3. Visual Studio Code extension installation.Figure 4. Visual Studio Code extension tree navigation.Figure 5. Web editor. You can also edit articles on the Web editor without installing anything locally.Video 3. Edit locally and publish demo. Source. This shows editing OurBigBook Markup and publishing it using the Visual Studio Code extension.Video 4. OurBigBook Visual Studio Code extension editing and navigation demo. Source. - Infinitely deep tables of contents:
All our software is open source and hosted at: github.com/ourbigbook/ourbigbook
Further documentation can be found at: docs.ourbigbook.com
Feel free to reach our to us for any help or suggestions: docs.ourbigbook.com/#contact


