Use one row per consecutive at-risk episode, retaining a patient identifier for dependence and an episode number for event order. In calendar time, the intervals are ; status is one if the row ends in a headache and zero if it ends in censoring. Patient 001 contributes
PatientNext-event episodeStartStopEvent
0011024.810
001224.833.110
001333.140.210
001440.251.910
001551.960.000
The fifth episode is censored, not a fifth observed headache. All rows retain . This start-stop recurrent-event data layout corresponds to the counting-process intensity in survival analysis
where indicates that the patient is currently observed and eligible for a headache. Fit the regression coefficient by Cox partial likelihood using the resulting risk sets, and estimate the baseline cumulative hazard nonparametrically, for example by the Breslow estimator. Patient rows are portions of one history, not new independent patients.
Keeping the event-free A individual under observation through day 193 leaves them in the risk set at both later B events. Now the calculations are
Event dayVariance
165221
180120
191110
Therefore
The negative score now indicates lower A event hazard, relative to B, in the contribution after day 160. The observed event counts have not changed. The change is in what events A was expected to contribute: its additional event-free exposure makes the two later B events informative comparisons, producing negative A score terms. No conclusion about the complete study's significance follows from this late contribution without the earlier scores and variances.
At day 165 there are two A and two B individuals at risk. The event is in A, with expected A count , so its score contribution is and its variance contribution is . The remaining A individual is censored at 173 and leaves the risk set before either later event. The risk-set calculations are
Event dayVariance
165221
180020000
191010000
Thus
The positive score indicates higher A event hazard in this late contribution. Although B has more observed events, its two events occur with no A individual at risk, so those times do not compare the groups. This is why raw event totals alone are insufficient for the log-rank test.
Within month two, each individual contributes only the time spent at risk between times one and two. There are complete one-month contributions. The six event contributions are , and the censored contribution is . Consequently
The month-specific likelihood factor in a piecewise-exponential survival model is , giving
The eight individuals no longer at risk at time one contribute no month-two exposure. Using either all 112 individuals or all 104 as full-month observations would give the wrong denominator.
Assume independent censoring: the censoring mechanism contributes no factor involving the lifetime rate . The exponential density and survival function are and . An observed event contributes the density; a right-censored lifetime contributes the probability of surviving its censoring time. Thus the likelihood for , up to censoring factors independent of it, is
For and , vanishes at , and proves the maximum:
Censored individuals add follow-up time to the denominator but no event to the numerator. If and , the likelihood decreases for and has only a supremum as ; zero is an extended boundary estimate, not a positive-rate exponential MLE. The derivation is for independent individuals entering at time zero; delayed entry would require conditional survival contributions and exposure measured from entry.
For equal independent samples, take , and in the two-proportion formula, with two-sided and power . It gives
Thus the usual normal planning estimate is
The combined approximate design therefore checks about eight blocks, with about eight positive batches from B and twenty-four from C at the rounded design.
Those expected counts are low enough for test discreteness to matter. If a genuinely exact two-sided Fisher exact test is specified, the null allocation of the positive batches between two equal-size suppliers is hypergeometric, conditional on their total. Under the proposed alternative, its power is obtained by summing the independent binomial probabilities over the exact rejection region:
An independent calculation of the exact power of Fisher's exact test gives about at and at . Consequently five whole 10,000-batch blocks per supplier suffice for at least 80% power with this conservative exact test. Four blocks are the intended normal-approximation answer, not an exact 80% guarantee irrespective of the chosen test. The distinction is a property of rare-event discreteness, not a change in the proposed effect size.
A numerical power calculation needs a significance level, desired power, sidedness and allocation; these are not specified in this part. For a concrete planning illustration, assume independent batches, equal samples per supplier, a two-sided 5% test with 80% power, and true rates and . The observed 2% from B and C is being used as a planning value for B, not as proof that B's population rate is exactly known. There is also a numerical inconsistency in the stated frame: at six batches per working day, B and C together produce only 120 batches in two weeks, and their proposed schemes would test 24. The asserted 3,000 sampled batches cannot literally come from that frame. The calculation treats as a stipulated planning estimate; its collection would require a larger frame or longer period.
For two independent sample proportions, the approximate null variance of their difference is and its variance at the alternative is , with . Separating the null critical value from the alternative mean by the required power quantile gives the sample size for comparing two proportions:
With , and , this gives , so the normal-approximation calculation rounds to 1,141 batches per supplier, or approximately 1,150 for a practical planning target. This is per supplier, not the combined total. A different power or a one-sided test changes the answer. Positive clustering of sampled batches requires a cluster-aware calculation or inflation, so the independent-batch calculation should not simply be applied to C's one-day clusters.
Under the one-test-per-day interpretation, A spreads surveillance across all five days and is operationally straightforward, but uses only five tests per week and does not guarantee morning/afternoon representation. Within each day its uniform choice avoids systematically selecting a particular batch. B uses six tests, guarantees representation of both production periods, and spreads the selected batches over the week's production, though some weekdays can receive no test. C also uses six tests and may minimize the cost of collecting samples, but concentrates them on one randomly selected day.
If batches produced on the same day share contamination risks, C's six observations are positively correlated and provide less information than six dispersed batches. A simple equal-cluster-size approximation has design effect , where is within-day intraclass correlation; its effective sample size is consequently smaller than six when . C can also miss intermittent problems occurring on other days.
I would prefer B for estimating and comparing batch contamination rates, assuming positive within-day correlation and no overriding collection-cost advantage for C. It combines slightly more testing than A with explicit production-period coverage and avoids C's concentration on a single day. A is a reasonable alternative when regular daily surveillance is the priority. All three are legitimate probability samples with the stated inclusion probabilities; the preference concerns precision and coverage, not a claim that C is intrinsically biased. Their relative efficiency is not universal without a model for production variability and costs.
Label batches before consulting the random-number table, so their labels are independent of the test results. A uniformly random permutation of , restricted to a smaller label set, induces a uniformly random ordering of that set. This provides a simple rejection-and-restriction scheme:
  • For A, label each day's six batches . Use a fresh permutation, discard labels , and test the first remaining batch. Repeat independently on each working day. Each daily batch has inclusion probability , and five batches are tested per week.
  • For B, label the fifteen weekly morning batches . Discard label 16 from a fresh permutation and choose the first three remaining labels. Use an independent permutation for the afternoon stratum. Every three-element subset within a stratum is equally likely, and each batch has inclusion probability . Six batches are tested per week.
  • For C, label the weekdays . Keep the first label in this range from a fresh permutation and test all six batches on that day. Repeat independently each week. Every day, and hence every batch, has inclusion probability ; six batches are tested per week.
With independent random digits instead, rejection sampling gives the same uniform choices: for A keep only digits ; for C keep only . For B, use uniform two-digit numbers, retain labels , and reject repeats within a three-batch sample. Taking residues modulo six or fifteen from a table whose range is not divisible by that number would give unequal probabilities. These are respectively day-stratified simple random sampling, morning/afternoon stratified sampling, and a one-day design using cluster sampling. The printed word “rest” for A is interpreted as “test”, consistently with the surveillance task. If it instead meant leaving one batch untested, choose that omitted batch uniformly and test the other five; this alternative would test 25 batches per week, with inclusion probability , and has a different testing budget.
One method is trim and fill. Estimate the direction and extent of funnel asymmetry, temporarily trim the extreme studies on the overrepresented side to estimate a centre, and fill in mirror-image studies on the underrepresented side. Recompute the pooled effect using the observed and imputed studies. This estimates what the summary might be under a symmetry-based missing-study model. It can move an exaggerated effect towards the null, but genuine heterogeneity can violate its symmetry assumptions.
A second method is a selection model for publication bias. Specify how the probability of a result being available depends on quantities such as its value, direction or precision, and combine that mechanism with a model for the underlying study effects. If a study estimate has density and availability probability , its observed density is proportional to , with a normalizing factor accounting for unobserved results. Fit the model, or vary the selection probabilities over plausible scenarios, to obtain selection-adjusted effects. Such models make assumptions about evidence that is missing, so their results are particularly useful as sensitivity analyses. Neither method removes publication bias without assumptions about the missing studies.
A funnel plot places each estimated log risk ratio horizontally and its standard error vertically, with the most precise studies at the top. Under a common-effect model without selective availability, less precise estimates should spread approximately symmetrically around the underlying effect. The plotted dashed limits are the pooled estimate plus or minus twice the standard error; they illustrate the expected sampling spread, not a test of publication bias by themselves.
Figure 1.
Funnel plot of the ten transfusion trial estimates, with inverse-variance pooled effect and approximate sampling limits
.
The least precise estimates are mostly far to the left, whereas the most precise estimates are close to zero. The reported regression slope means that increasing the standard error by one unit is associated with a decrease of about in the estimated log risk ratio. Its 95% confidence interval excludes zero, and gives evidence against a zero slope under that regression model. This is evidence of a small-study effect: less precise trials report stronger apparent benefit.
There is evidence consistent with publication bias, but asymmetry does not identify its cause. Selective availability of favourable small studies is a plausible explanation. Genuine differences in patient populations, trial quality, interventions or effect modification could also generate the pattern, and there are only ten trials. The given outcome-on-error regression should be interpreted as specified; it is not automatically the original standardized-effect-on-precision form of an Egger test. The plot and slope justify investigating missing studies and sensitivity to selection, rather than concluding that publication bias has been proved.
Publication bias occurs when the availability or publication of a study depends on its results, for example their direction or statistical significance. The published studies then need not represent all studies meeting the review's eligibility criteria. This is different from unbiased studies simply having large sampling errors.
If mortality reductions favouring transfusion are more likely to be published than null or unfavourable findings, the observed log risk ratios will tend to be too negative and the pooled risk ratio too small. The apparent benefit will then be exaggerated. An ordinary meta-analysis interval ignores uncertainty about the missing evidence and may have poor coverage even if its sampling-variance calculation is correct for the studies included. The direction of bias depends on which results are preferentially made available; publication bias does not invariably favour a particular treatment.
Let be each trial's estimated log risk ratio, with estimated sampling variance . A fixed-effect meta-analysis models the independent estimates as , with one common true log risk ratio . Differentiating the Gaussian log-likelihood, or minimizing , gives inverse-variance weights and
The variance follows directly by adding independent variances of the weighted estimates: .
Using the printed rounded estimates and standard errors, , so
The pooled risk ratio is about . An interval using the same quantile two is on the log scale, so it includes no effect. Recomputing all trial estimates from the event counts would change the last digits because the printed log estimates and errors are rounded.
The key assumptions are independent trials, a common true treatment effect on this chosen log scale, approximately unbiased and approximately normal trial estimates, and suitable sampling-variance estimates. The common-effect assumption is stronger than merely studying the same named treatment: systematic population, treatment or design differences may produce genuine heterogeneity. For an unbiased interpretation of the pooled evidence, inclusion of studies must also not depend selectively on their results. Treating the plug-in variances as fixed is the usual approximation in the displayed variance formula.
For independent binomial distributions in the two trial arms, the estimate of the log risk ratio is
The delta method gives ; replacing by the sample proportion gives , where is the event count. Adding the independent arm contributions therefore gives
The standard error is . Using the stipulated normal quantile two, the approximate confidence interval is
The point estimate of the risk ratio is , corresponding to approximately 79% lower mortality risk in the transfusion arm. Exponentiating the endpoints gives an approximate 95% confidence interval for the risk ratio of . It includes one, so the trial is compatible with no difference as well as substantial benefit or some harm. The point estimate favours transfusion, but the data are too imprecise to establish a difference at the 5% level. These are large-sample approximations, especially rough with only one event in an arm. A frequentist confidence interval describes repeated-sampling coverage, not a 95% posterior probability for this fixed parameter.

Pinned article: Introduction to the OurBigBook Project

Welcome to the OurBigBook Project! Our goal is to create the perfect publishing platform for STEM subjects, and get university-level students to write the best free STEM tutorials ever.
Everyone is welcome to create an account and play with the site: ourbigbook.com/go/register. We belive that students themselves can write amazing tutorials, but teachers are welcome too. You can write about anything you want, it doesn't have to be STEM or even educational. Silly test content is very welcome and you won't be penalized in any way. Just keep it legal!
We have two killer features:
  1. topics: topics group articles by different users with the same title, e.g. here is the topic for the "Fundamental Theorem of Calculus" ourbigbook.com/go/topic/fundamental-theorem-of-calculus
    Articles of different users are sorted by upvote within each article page. This feature is a bit like:
    • a Wikipedia where each user can have their own version of each article
    • a Q&A website like Stack Overflow, where multiple people can give their views on a given topic, and the best ones are sorted by upvote. Except you don't need to wait for someone to ask first, and any topic goes, no matter how narrow or broad
    This feature makes it possible for readers to find better explanations of any topic created by other writers. And it allows writers to create an explanation in a place that readers might actually find it.
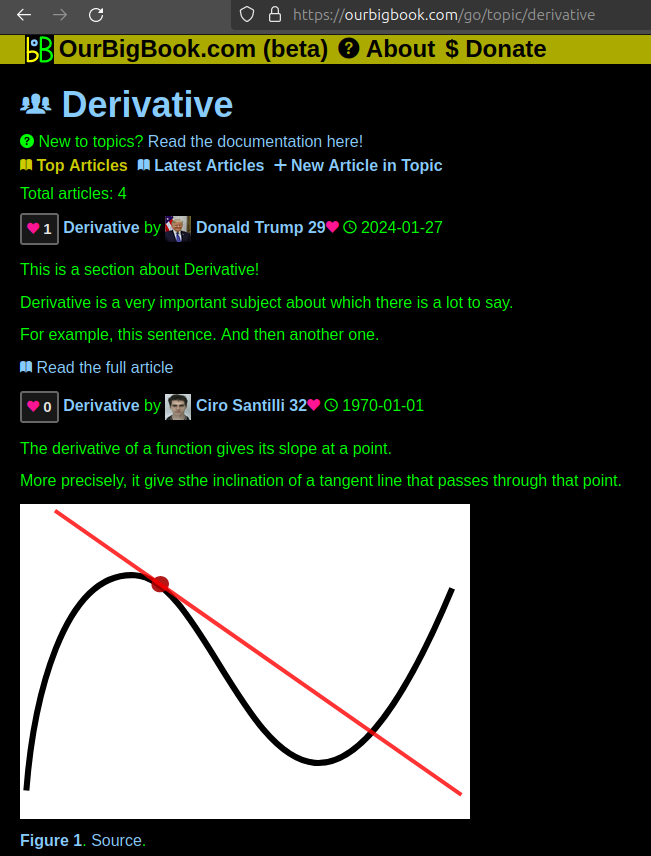
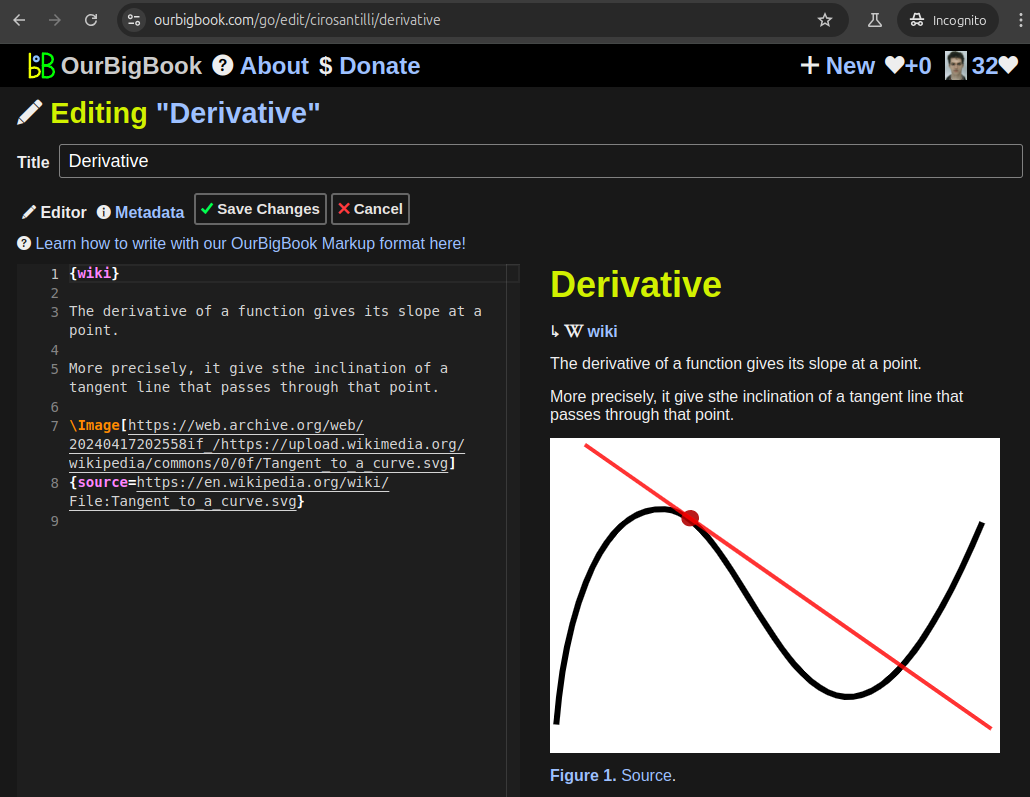
    Figure 1.
    Screenshot of the "Derivative" topic page
    . View it live at: ourbigbook.com/go/topic/derivative
  2. local editing: you can store all your personal knowledge base content locally in a plaintext markup format that can be edited locally and published either:
    This way you can be sure that even if OurBigBook.com were to go down one day (which we have no plans to do as it is quite cheap to host!), your content will still be perfectly readable as a static site.
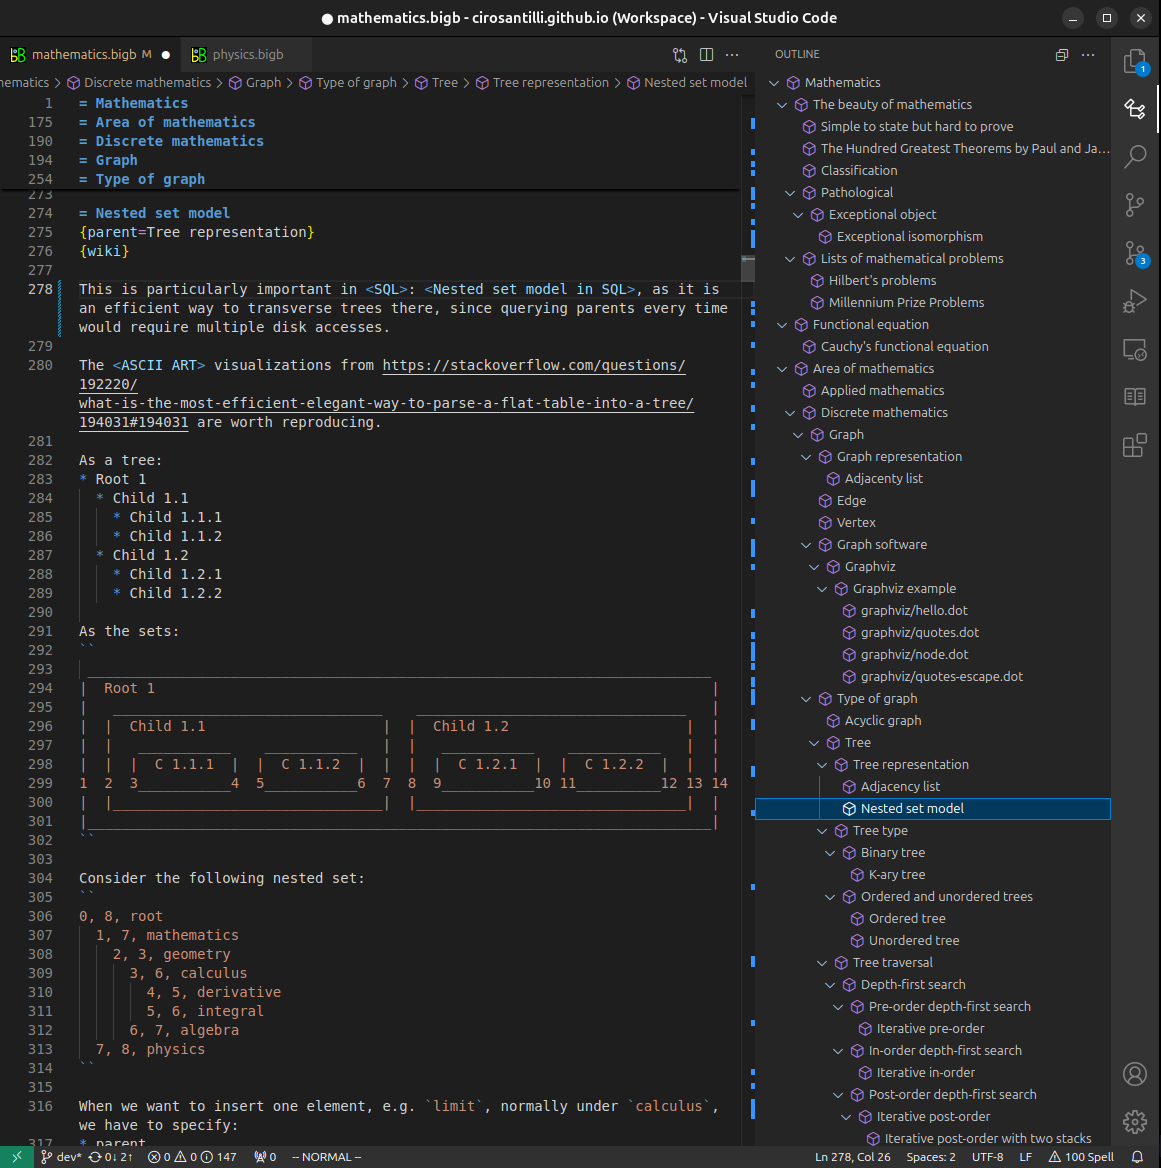
    Figure 5. . You can also edit articles on the Web editor without installing anything locally.
    Video 3.
    Edit locally and publish demo
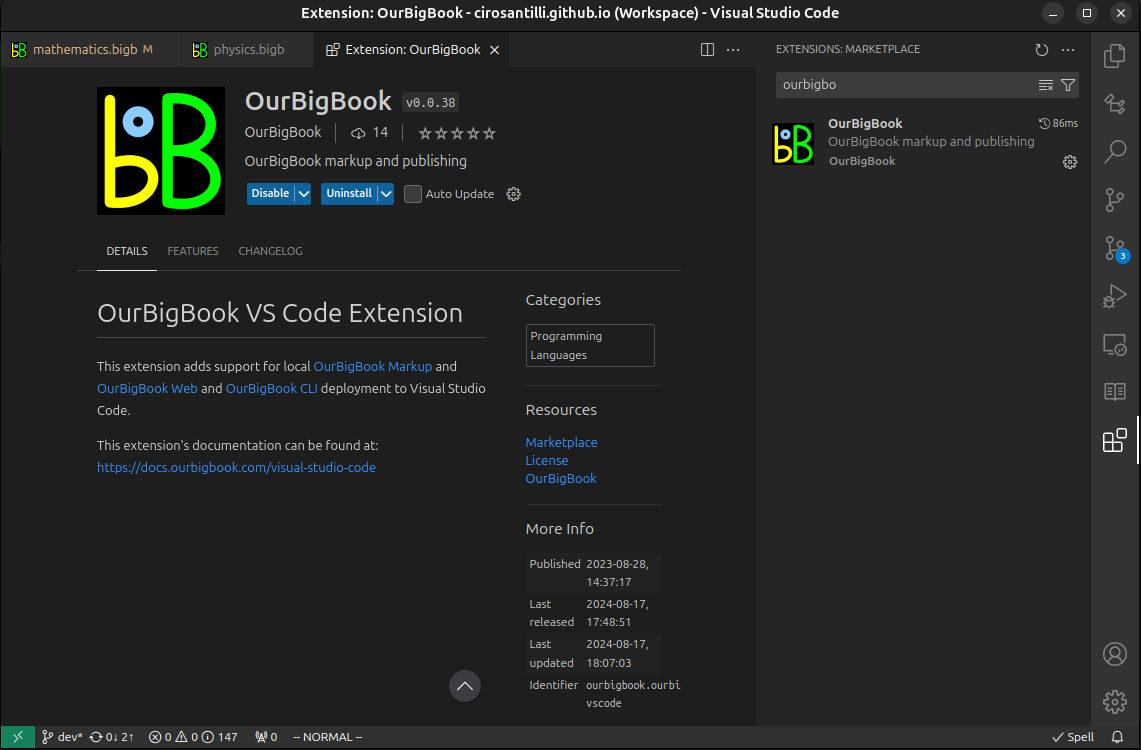
    . Source. This shows editing OurBigBook Markup and publishing it using the Visual Studio Code extension.

  3. https://raw.githubusercontent.com/ourbigbook/ourbigbook-media/master/feature/x/hilbert-space-arrow.png
  4. Infinitely deep tables of contents:
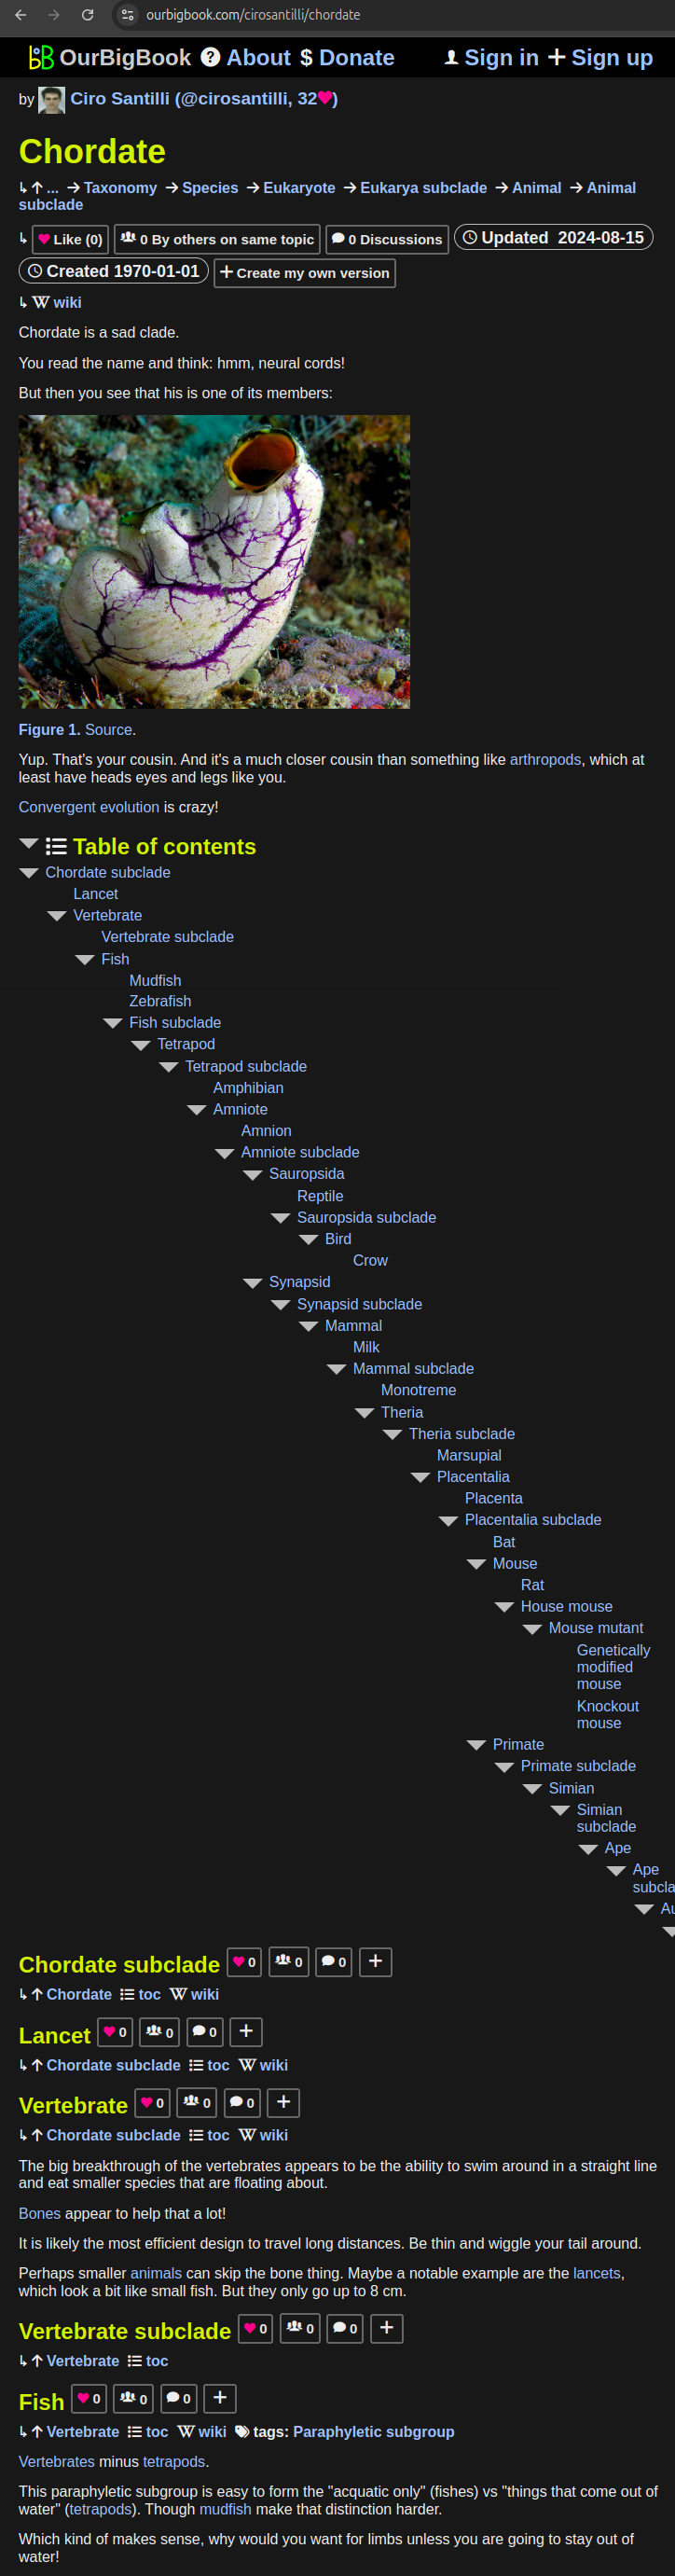
    Figure 6.
    Dynamic article tree with infinitely deep table of contents
    .
    Descendant pages can also show up as toplevel e.g.: ourbigbook.com/cirosantilli/chordate-subclade
All our software is open source and hosted at: github.com/ourbigbook/ourbigbook
Further documentation can be found at: docs.ourbigbook.com
Feel free to reach our to us for any help or suggestions: docs.ourbigbook.com/#contact