
A mass spectrum displays detected signal against mass-to-charge ratio. Peak positions identify candidate ions; peak areas give isotopic abundances only after the response and overlapping contributions have been accounted for.
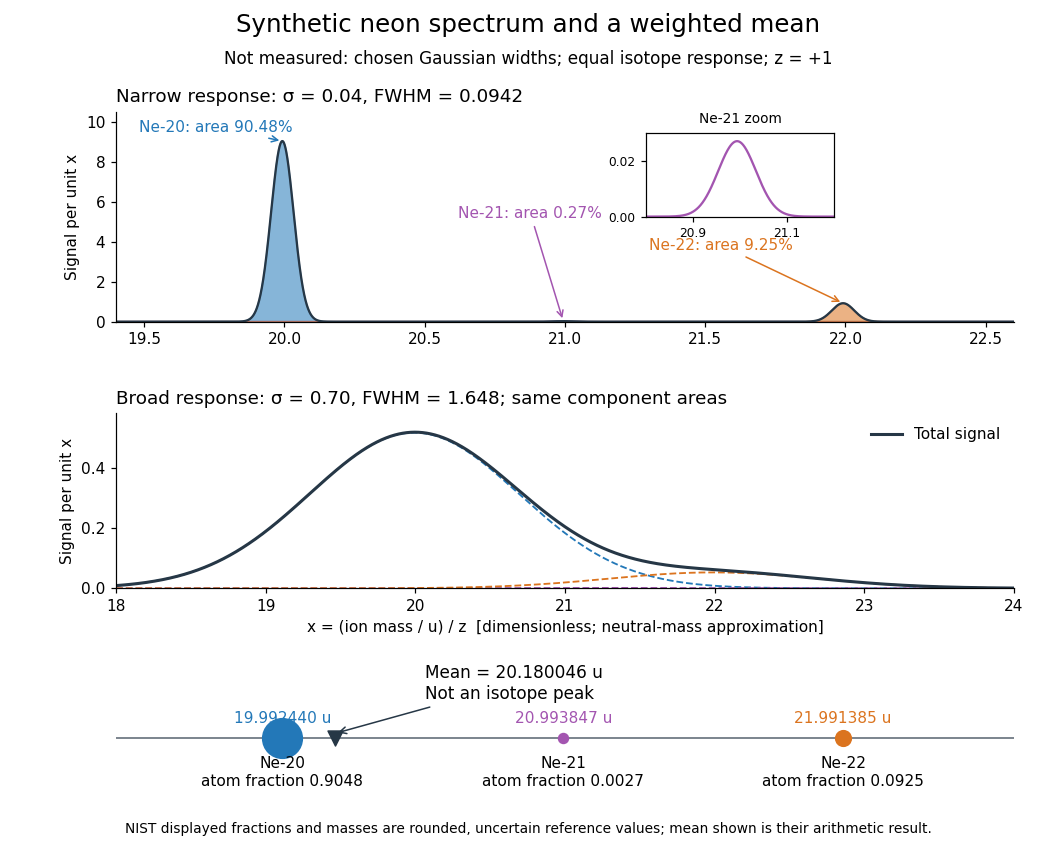

Broadening can hide a weak component without changing its area in this ideal model. An actual mass spectrum can also contain molecular ions, different electric charge states, background, and unequal detection responses. A missing visible peak therefore cannot by itself prove the absence of an isotope. Conversely, a fractional atomic weight is a property of a population: there is no requirement for an ion peak at the weighted mean.
New to topics? Read the docs here!