More generic PCR information at: Section "Polymerase chain reaction".
Because it is considered the less interesting step, and because it takes quite some time, this step was done by the event organizers between the two event days, so participants did not get to take many photos.
PCR protocols are very standard it seems, all that biologists need to know to reproduce is the time and temperature of each step.
This process used a Marshal Scientific MJ Research PTC-200 Thermal Cycler:
We added PCR primers for regions that surround the 16S DNA. The primers are just bought from a vendor, and we used well known regions are called 27F and 1492R. Here is a paper that analyzes other choices: academic.oup.com/femsle/article/221/2/299/630719 (archive) "Evaluation of primers and PCR conditions for the analysis of 16S rRNA genes from a natural environment" by Yuichi Hongoh, Hiroe Yuzawa, Moriya Ohkuma, Toshiaki Kudo (2003)
One cool thing about the PCR is that we can also add a known barcode at the end of each primer as shown at Code 1. "PCR diagram".
This means that we bought a few different versions of our 27F/1492R primers, each with a different small DNA tag attached directly to them in addition to the matching sequence.
This way, we were able to:
- use a different barcode for samples collected from different locations. This means we
- did PCR separately for each one of them
- for each PCR run, used a different set of primers, each with a different tag
- the primer is still able to attach, and then the tag just gets amplified with the rest of everything!
- sequence them all in one go
- then just from the sequencing output the barcode to determine where each sequence came from!
Input: Bacterial DNA (a little bit)
... --- 27S --- 16S --- 1492R --- ...

|||
|||
vvv

Output: PCR output (a lot of)
Barcode --- 27S --- 16S --- 1492R
Code 1.
PCR diagram
. Finally, after purification, we used the Qiagen QIAquick PCR Purification Kit protocol to purify the generated from unwanted PCR byproducts.
For this reason, it is wise to verify that certain steps are correct whenever possible.
Gel electrophoresis separates molecules by their charge-to-mass ratio. It is one of those ultra common lab procedures!
Since we know that we amplified the 16S regions which we know the rough size of (there might be a bit of variability across species, but not that much), we were expecting to see a big band at that size.
And that is exactly what we saw!
First we had to prepare the gel, put the gel comb, and pipette the samples into wells present in the gel:
To see the DNA, we added ethidium bromide to the samples, which is a substance that that both binds to DNA and is fluorescent.
Because it interacts heavily with DNA, ethidium bromide is a mutagen, and the biology people sure did treat the dedicated electrophoresis bench area with respect! Figure 4. "Gel electrophoresis dedicated bench area to prevent ethidium bromide contamination.".
Gel electrophoresis dedicated bench area to prevent ethidium bromide contamination.
Source. Gel electrophoresis dedicated waste bin for centrifuge tubes and pipette tips contaminated with ethidium bromide.
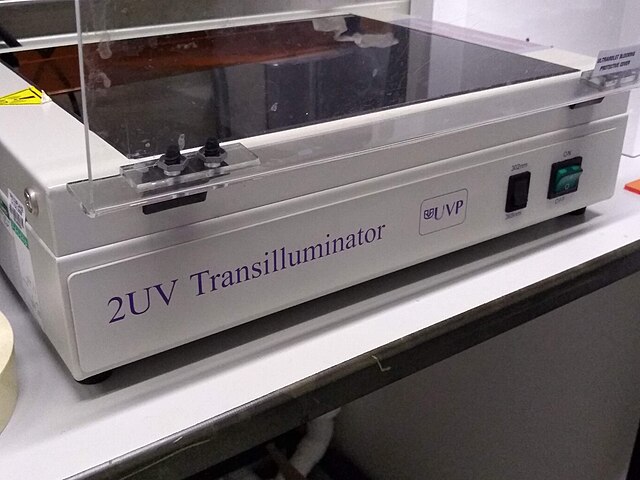
Source. The UV transilluminator we used to shoot UV light into the gel was the Fisher Scientific UVP LM-26E Benchtop 2UV Transilluminator. The fluorescent substance then emitted a light we can see.
As barely seen at Figure 8. "Fischer Scientific UVP LM-26E Benchtop 2UV Transilluminator illuminated gel." due to bad photo quality due to lack of light, there is one strong green line, which compared to the ladder matches our expected 16S length. What we saw it with the naked eyes was very clear however.
Articles by others on the same topic
There are currently no matching articles.


