Ciro Santilli believes that molecular biology technologies will be a large part of the next big things as shown at: Section "Molecular biology technologies".
Bibliography:
- www.youtube.com/watch?v=mS563_Teges&list=PLQbPquAyEw4dQ3zOLrdS1eF_KJJbUUyBx Biophysical Techniques Course 2022 by the MRC Laboratory of Molecular Biology. Holy crap that playlist is a tour de force of molecular biology techniques in 2022!
Since DNA is the centerpiece of life, Ciro Santilli is extremely excited about DNA-related technologies, see also: molecular biology technologies.
epigenetics mechanism.
These are apparenty an important part of transcriptional regulation given the number of modifications they can undergo! Quite exciting.
This can be used to detect if a given species of microorganism is present in a sample, and is therefore a widely used diagnostics technique to see if someone is infected with a virus.
You could of course do full DNA Sequencing to see everything that is there, but since it is as a more generic procedure, sequencing is more expensive and slow.
The alternative is to use a DNA amplification technique.
DNA amplification is one of the key DNA technologies:
- it is one of the main ways in which DNA detection can be done.
- it is the first step of Illumina sequencing, since you need multiple copies of several parts of the genome for the method to work
This is an extremely widely used technique as of 2020 and much earlier.
If allows you to amplify "any" sequence of choice (TODO length limitations) between a start and end sequences of interest which you synthesize.
If the sequence of interest is present, it gets amplified exponentially, and you end up with a bunch of DNA at the end.
You can then measure the DNA concentration based on simple light refraction methods to see if there is a lot of DNA or not in the post-processed sample.
Even Ciro Santilli had some contact with it at: Section "How to use an Oxford Nanopore MinION to extract DNA from river water and determine which bacteria live in it", see: PCR!
One common problem that happens with PCR if you don't design your primers right is: en.wikipedia.org/wiki/Primer_dimer
Sometime it fails: www.reddit.com/r/molecularbiology/comments/1kouomw/when_your_pcr_fails_again_and_you_start/and a comment:
Nothing humbles you faster than a bandless gel. One minute you’re a scientist, the next you’re just a pipette-wielding wizard casting spells that don’t work. Meanwhile, physicists are out there acting like gravity always behaves. Smash that upvote if your reagents have ever gaslit you.
PCR = Pray, Cry, Repeat
Also known as: Quantitative PCR (qPCR).
This describes one possible concentration detection method with fluorescent molecules that only become fluorescent when the DNA is double stranded (SYBR Green)
Polymerase Chain Reaction (PCR) - Quantitative PCR (qPCR) by Applied Biological Materials (2016)
Source. This allows you to predict the exact initial concentration by extrapolating the exponential curve backwards.
TODO: vs non-real-time PCR. Why can't you just divide by 2 for every heating step to reach back the original concentration? Likely the reaction reach saturation at an unknown step.
TODO: vs non-real-time PCR in medical diagnostics: do you really need to know concentration for diagnostics? Isn't it enough to know if the virus is present or not?
Isothermal means "at fixed temperature".
This is to contrast with the more well established polymerase chain reaction, which requires heating and cooling the sample several times.
The obvious advantage of isothermal methods is that their machinery can be simpler and cheaper, and the process can happen faster, since you don't have to do through heating and cooling cycles.
Like PCR, but does not require thermal cycling. Thus the "isothermal" in the name: iso means same, so "same temperature".
Not needing the thermo cycling means that the equipment needed is much smaller and cheaper it seems.
Trade-offs question: biology.stackexchange.com/questions/92172/what-are-the-trade-offs-between-polymerase-chain-reaction-pcr-vs-loop-mediated
Caused by slipped strand mispairing.
oriC = Origin of Chromosomal replication.
Big excitement picture at: molecular biology technologies.
Most of these are going to be Whole-genome sequencing of some model organism:en.wikipedia.org/wiki/Whole_genome_sequencing#History lists them all. Basically th big "firsts" all happened in the 1990s and early 2000s.
- 1975 by Sanger et al.: 5 kbp of the single-stranded bacteriophage ΦX174 using Sanger's radiolabelling method
- 1981 by Sanger et al.: 17 kbp of human mitochondrial DNA via Sanger method, known as the Cambridge Reference Sequence
- 2003: Human Genome Project (3 Gbp)
Can be seen as a cheap form of DNA sequencing that only test for a few hits. Some major applications:
- gene expression profiling
- single-nucleotide polymorphism: specificity is high enough to detect snips
Experiments that involve sequencing bulk DNA found in a sample to determine what species are present, as opposed to sequencing just a single specific specimen. Examples of samples that are often used:
- river water to determine which bacteria are present, notably to determine if the water is free of dangerous bacteria. A concrete example is shown at: Section "How to use an Oxford Nanopore MinION to extract DNA from river water and determine which bacteria live in it".
- sea water biodiversity: ocean-microbiome.embl.de/companion.html
- food, including searching for desirable microorganisms such as in cheese or bread yeast
- poo, e.g. to study how the human microbiome influences health. There are companies actively working on this, e.g.: www.microbiotica.com/
One related application which most people would not consider metagenomics, is that of finding circulating tumor DNA in blood to detect tumors.
Sequencing the DNA tells us what the organism can do. Sequencing the RNA tells us what the organism is actually doing at a given point in time. The problem is not killing the cell while doing that. Is it possible to just take a chunk of the cell to sequence without killing it maybe?
- techcrunch.com/2022/05/31/ultima-genomics-claims-100-full-genome-sequencing-after-stealth-600m-raise/ Ultima genomics TODO technology? Promises 100 USD genome, 600M funding out of stealth...
The by far dominating DNA sequencing company of the late 2000's and 2010's due to having the smallest cost per base pair.
To understand how Illumina's technology works basically, watch this video: Video 1. "Illumina Sequencing by Synthesis by Illumina (2016)".
The key innovation of this method is the Bridge amplification step, which produces a large amount of identical DNA strands.
This step is genius because sequencing is basically a signal-to-noise problem, as you are trying to observe individual tiny nucleotides mixed with billions of other tiny nucleotides.
With bridge amplification, we group some of the nucleotides together, and multiply the signal millions of times for that part of the DNA.

Instead of trying to dominate the sequencing market and gain trillions of dollars from it, they local British early stage investors were more than happy to get a 20x return on their small initial investments, and sold out to the Americans who will then make the real profit.
And now Solexa doesn't even have its own Wikipedia page, while Illumina is set out to be the next Microsoft. What a disgrace.
Cambridge visitors can still visit the Panton Arms pub, which was the location of the legendary "hey we should talk" founders meeting, chosen due to its proximity to the chemistry department of the University of Cambridge.
In 2021 the founders were awarded the Breakthrough Prize. The third person awarded was Pascal Mayer. He was apparently at Serono Pharmaceutical Research Institute at the time of development. They do have a wiki page unlike Solexa: en.wikipedia.org/wiki/Serono. They paid a 700 million fine in 2005 in the United States, and sold out in 2006 to Merck for 10 billion USD.
Bibliography:
- medium.com/@nick.mccooke/how-we-pioneered-next-generation-dna-sequencing-at-solexa-61bac41aedd2 How We Pioneered Next Generation DNA Sequencing At Solexal by Nick McCooke 2025. This article series could be very interesting.
They put a lot of emphasis into base calling. E.g.:
- they have used FPGAs to accelerate it on certain models: twitter.com/nanopore/status/841671404588302338, sampe engineer: www.linkedin.com/in/balaji-renganathan-31b98415/
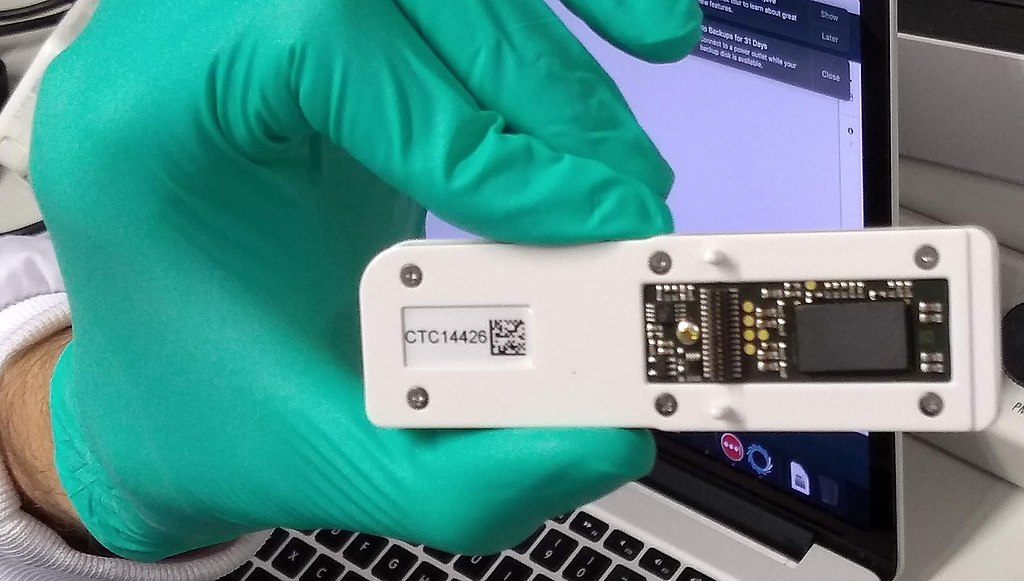
One of the sequencers made by Oxford Nanopore Technologies.
The device has had several updates since however, notably of the pore proteins which are present in the critical flow cell consumable.
Official documentation: nanoporetech.com/products/minion (archive)
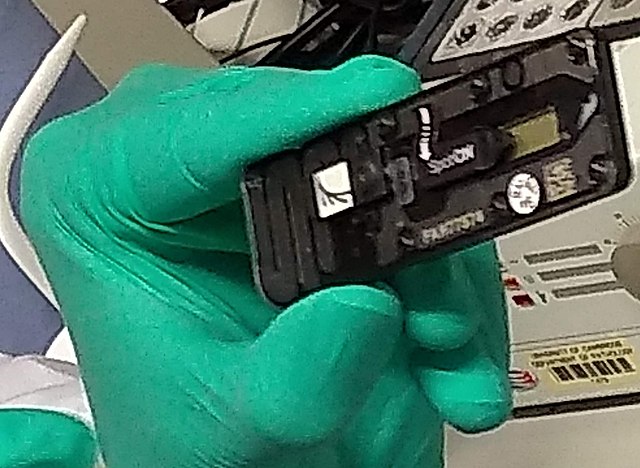
The following images of the device and its peripherals were taken during the experiment: Section "How to use an Oxford Nanopore MinION to extract DNA from river water and determine which bacteria live in it".
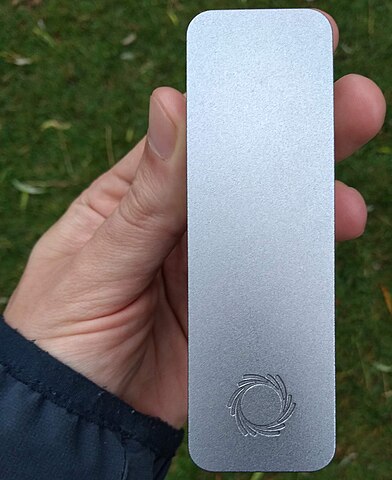
Top view of a closed Oxford Nanopore MinION
. Source. Side view of an Oxford Nanopore MinION
. Source. 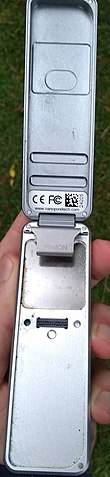
Top view of an open Oxford Nanopore MinION
. Source. 


This article gives an idea of how this kind of biological experiment feels like to a software engineer who has never done any biology like Ciro Santilli.
PuntSeq is a side project led by a few University of Cambridge PhDs that aims to determine which bacteria are present in the River Cam.
In July 2019, the PuntSeq team got together with the awesome Cambridge Biomakespace, an awesome biology makerspace open to all, to create a two day science outreach activity showing their procedures.
The data collected in this experiment, together with other collection sessions done by the organizers actually led to a publication on eLife: elifesciences.org/articles/61504 "Freshwater monitoring by nanopore sequencing" by Lara Urban et al. (2021), so it is awesome to see that were are actual being part of "real science".
Ciro knows nothing about biology, but since he is very curious about it, he jumped at this opportunity, and decided to document things as well as his limited knowledge would allow.
All participants chipped in some money to help cover the experiment's costs. Ciro suspects that this activity was done partially to help crowdfund the experiment, but it was a worthy investment!
The impressions you get from the experiment as a software engineer will be:
- OMG, this is so labour intensive, why haven't they automated this
- OMG, this is frightening, all the 8 hours of work I've just done are present in that tiny plastic tube
- Amazing! Look at that apparatus! And the bio people are like: I've used this a million times, it's cheap and every lab has one, just work faster and don't break you piece of junk!
For those that know biology and just want to do the thing, see: Section "Protocols used".
The PuntSeq team uses an Oxford Nanopore MinION DNA sequencer made by Oxford Nanopore Technologies to sequence the 16S region of bacterial DNA, which is about 1500 nucleotides long.
This kind of "decode everything from the sample to see what species are present approach" is called "metagenomics".
This is how the MinION looks like: Figure 1. "Oxford Nanopore MinION top".
Oxford Nanopore MinION top open
. Source. Before sequencing the DNA, we will do a PCR with primers that fit just before and just after the 16S DNA, in well conserved regions expected to be present in all bacteria.
The PCR replicates only the DNA region between our two selected primers a gazillion times so that only those regions will actually get picked up by the sequencing step in practice.
Eukaryotes also have an analogous ribosome part, the 18S region, but the PCR primers are selected for targets around the 16S region which are only present in prokaryotes.
This way, we amplify only the 16S region of bacteria, excluding other parts of bacterial genome, and excluding eukaryotes entirely.
Despite coding such a fundamental piece of RNA, there is still surprisingly variability in the 16S region across different bacteria, and it is those differences will allow us to identify which bacteria are present in the river.
The variability exists because certain base pairs are not fundamental for the function of the 16S region. This variability happens mostly on RNA loops as opposed to stems, i.e. parts of the RNA that don't base pair with other RNA in the RNA secondary structure as shown at: Code 1. "RNA stem-loop structure".
This is how the 16S RNA secondary structure looks like in its full glory: Figure 5. "16S RNA secondary structure".

Since loops don't base pair, they are less crucial in the determination of the secondary structure of the RNA.
The variability is such that it is possible to identify individual species apart if full sequences are known with certainty.
With the experimental limitations of experiment however, we would only be able to obtain family or genus level breakdowns.
At the time of the experiment, Illumina equipment was cheaper per base pair and dominates the human genome sequencing market, but it required a much higher initial investment for the equipment (TODO how much).
The reusable Nanopore device costs just about 500 dollars, and about 500 dollars (50 unit volume) for the single usage flow cell which can decode up to 30 billion base pairs, which is about 10 human genomes 1x! Note that 1x is basically useless for one of the most important of all applications of sequencing: detection of single-nucleotide polymorphisms, since the error rate would be too high to base clinical decisions on.
Compare that to Illumina which is currently doing about an 1000 dollar human genome at 30x, and a bit less errors per base pair (TODO how much).
Other advantages of the MinION over Illumina which didn't really matter to this particular experiment are:
- portability for e.g. to do analysis on the field near infections outbreaks. Compare that to the smallest Illumina sequencer currently available in 2019, the iSeq 100: Figure 1. "Illumina iSeq 100 DNA sequencer".
- long reads which can be necessary for long repetitive regions, see also: Section "Sequence alignment"

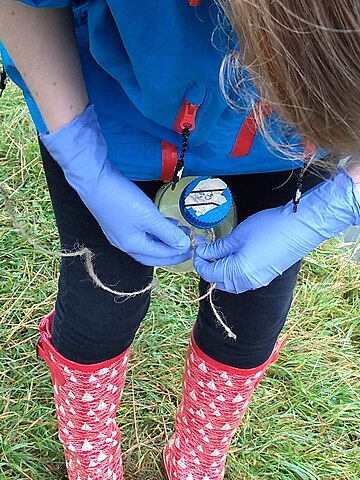
As you would expect, not much secret here, we just dumped a 1 liter glass bottle with a rope attached around the neck in a few different locations of the river, and pulled it out with the rope.


The first thing we had to do with the sample was to extract the DNA present in the water in a pure form for the PCR.
In each step we take a physical or chemical action on the sample, which splits it into two parts: the one with the DNA and the one without.
The first thing we did was to filter the water samples with a membrane filter that is so fine that not even bacteria can pass through, but water can.
Therefore, after filtration, we would have all particles such as bacteria and larger dirt pieces in the filter.
From the 1 liter in each bottle, we only used 400 ml because previous experiments showed that filtering the remaining 600 ml is very time consuming because the membrane filter gets clogged up.
Therefore, the filtration step allows us to reduce those 400 ml volumes to more manageable Eppendorf tube volumes: Figure 1. "An Eppendorf tube". Reagents are expensive, and lab bench centrifuges are small!

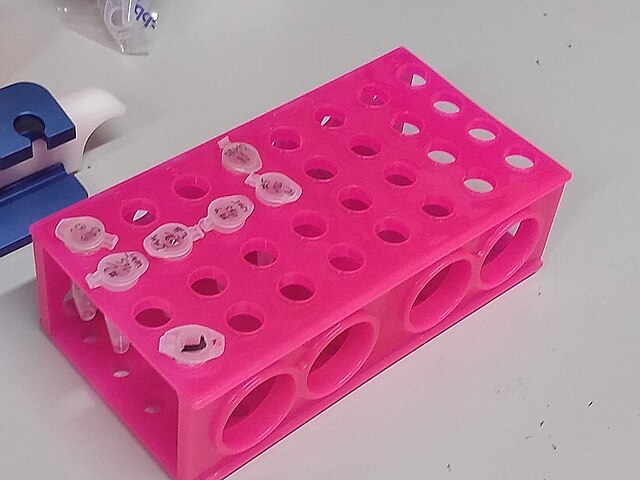
Labelled Eppendorf tubes on a rack
. Source. Since the filter is so fine, filtering by gravity alone would take forever, and so we used a vacuum pump to speed thing up!
For that we used:

Peeling the vacuum pump filter protection peel before usage
. Source. 
Placing the vacuum pump filter
. Source. After filtration, all DNA should present in the filter, so we cut the paper up with scissors and put the pieces into an Eppendorf: Video 1. "Cutting vacuum pump filter and placing it in Eppendorf".
Cutting vacuum pump filter and placing it in Eppendorf
. Source. Now that we had the DNA in Eppendorfs, we were ready to continue the purification in a simpler and more standardized lab pipeline fashion.
First we added some small specialized beads and chemicals to the water and shook them Eppendorfs hard in a Scientific Industries Inc. Vortex-Genie 2 machine to break the cell and free the DNA.
Once that was done, we added several reagents which split the solution into two phases: one containing the DNA and the other not. We would then pipette the phase with the DNA out to the next Eppendorf, and continue the process.
In one step for example, the DNA was present as a white precipitate at the bottom of the tube, and we threw away the supernatant liquid: Figure 1. "White precipitate formed with Qiagen DNeasy PowerWater Kit".

At various stages, centrifuging was also necessary. Much like the previous vacuum pump step, this adds extra gravity to speed up the separation of phases with different molecular masses.


Then, when we had finally finished all the purification steps, we measured the quantity of DNA with a Biochrom SimpliNano spectrophotometer to check that the purification went well:


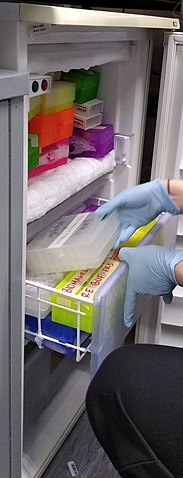
And because the readings were good, we put it in our -20 C fridge to preserve it until the second day of the workshop and called it a day:
More generic PCR information at: Section "Polymerase chain reaction".
Because it is considered the less interesting step, and because it takes quite some time, this step was done by the event organizers between the two event days, so participants did not get to take many photos.
PCR protocols are very standard it seems, all that biologists need to know to reproduce is the time and temperature of each step.
This process used a Marshal Scientific MJ Research PTC-200 Thermal Cycler:

We added PCR primers for regions that surround the 16S DNA. The primers are just bought from a vendor, and we used well known regions are called 27F and 1492R. Here is a paper that analyzes other choices: academic.oup.com/femsle/article/221/2/299/630719 (archive) "Evaluation of primers and PCR conditions for the analysis of 16S rRNA genes from a natural environment" by Yuichi Hongoh, Hiroe Yuzawa, Moriya Ohkuma, Toshiaki Kudo (2003)
One cool thing about the PCR is that we can also add a known barcode at the end of each primer as shown at Code 1. "PCR diagram".
This means that we bought a few different versions of our 27F/1492R primers, each with a different small DNA tag attached directly to them in addition to the matching sequence.
This way, we were able to:
- use a different barcode for samples collected from different locations. This means we
- did PCR separately for each one of them
- for each PCR run, used a different set of primers, each with a different tag
- the primer is still able to attach, and then the tag just gets amplified with the rest of everything!
- sequence them all in one go
- then just from the sequencing output the barcode to determine where each sequence came from!
Input: Bacterial DNA (a little bit)
... --- 27S --- 16S --- 1492R --- ...

|||
|||
vvv

Output: PCR output (a lot of)
Barcode --- 27S --- 16S --- 1492R
Code 1.
PCR diagram
. Finally, after purification, we used the Qiagen QIAquick PCR Purification Kit protocol to purify the generated from unwanted PCR byproducts.
For this reason, it is wise to verify that certain steps are correct whenever possible.
Gel electrophoresis separates molecules by their charge-to-mass ratio. It is one of those ultra common lab procedures!
Since we know that we amplified the 16S regions which we know the rough size of (there might be a bit of variability across species, but not that much), we were expecting to see a big band at that size.
And that is exactly what we saw!
First we had to prepare the gel, put the gel comb, and pipette the samples into wells present in the gel:


To see the DNA, we added ethidium bromide to the samples, which is a substance that that both binds to DNA and is fluorescent.
Because it interacts heavily with DNA, ethidium bromide is a mutagen, and the biology people sure did treat the dedicated electrophoresis bench area with respect! Figure 4. "Gel electrophoresis dedicated bench area to prevent ethidium bromide contamination.".


Gel electrophoresis dedicated waste bin for centrifuge tubes and pipette tips contaminated with ethidium bromide.
Source. The UV transilluminator we used to shoot UV light into the gel was the Fisher Scientific UVP LM-26E Benchtop 2UV Transilluminator. The fluorescent substance then emitted a light we can see.
As barely seen at Figure 8. "Fischer Scientific UVP LM-26E Benchtop 2UV Transilluminator illuminated gel." due to bad photo quality due to lack of light, there is one strong green line, which compared to the ladder matches our expected 16S length. What we saw it with the naked eyes was very clear however.
One cool thing we did in this procedure was to use magnetic separation with magnetic beads to further concentrate the DNA: Figure 1. "GE MagRack 6 pipetting.".
The beads are coated to stick to the DNA, which allows us to easily extract the DNA from the rest of the solution. This is cool, but bio people are borderline obsessed by those beads! Go figure!


Then we prepared the DNA for sequencing with the Oxford Nanopore specific part: Oxford Nanopore SQK-LSK109 Ligation Sequencing Kit.
Here some of the steps required a bit more of vortexing for mixing the reagents, and for this we used the VELP Scientifica WIZARD IR Infrared Vortex Mixer which appears to be quicker to use and not as strong as the Vortex Genie 2 previously used to break up the cells:

After all that was done, the DNA of the several 400 ml water bottles and hours of hard purification labour were contained in one single Eppendorf!
With all this ready, we opened the Nanopore flow cell, which is the 500 dollar consumable piece that goes in the sequencer.
We then had to pipette the final golden Eppendorf into the flow cell. My anxiety levels were going through the roof: Figure 4. "Oxford nanopore MinION flow cell pipette loading.".
At this point bio people start telling lab horror stories of expensive solutions being spilled and people having to recover them from fridge walls, or of how people threw away golden Eppendorfs and had to pick them out of trash bins with hundreds of others looking exactly the same etc. (but also how some discoveries were made like this). This reminded Ciro of: youtu.be/89UNPdNtOoE?t=919 Alfred Maddock's plutonium spill horror story.
Luckily this time, it worked out!
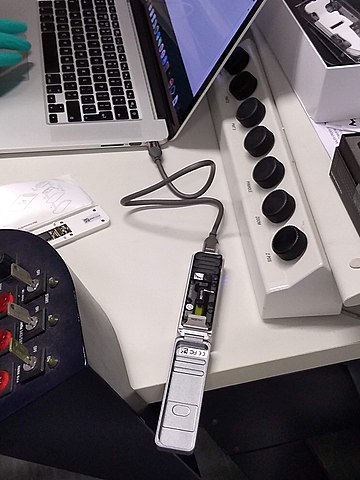
As can be seen from Video 1. "Oxford Nanopore MinION software channels pannel on Mac." the software tells us which pores are still working.
Pores go bad sooner or later randomly, until there are none left, at which point we can stop the process and throw the flow cell away.
48 hours was expected to be a reasonable time until all pores went bad, and so we called it a day, and waited for an email from the PuntSeq team telling us how things went.
We reached a yield of 16 billion base pairs out of the 30Gbp nominal maximum, which the bio people said was not bad.
Because Ciro's a software engineer, and he's done enough staring in computers for a lifetime already, and he believes in the power of Git, he didn't pay much attention to this part ;-)
According to the eLife paper, the code appears to have been uploaded to: github.com/d-j-k/puntseq. TODO at least mention the key algorithms used more precisely.
Ciro can however see that it does present interesting problems!
Because it was necessary to wait for 2 days to get our data, the workshop first reused sample data from previous collections done earlier in the year to illustrate the software.
First there is some signal processing/machine learning required to do the base calling, which is not trivial in the Oxford Nanopore, since neighbouring bases can affect the signal of each other. This is mostly handled by Oxford Nanopore itself, or by hardcore programmers in the field however.
After the base calling was done, the data was analyzed using computer programs that match the sequenced 16S sequences to a database of known sequenced species.
This is of course not just a simple direct string matching problem, since like any in experiment, the DNA reads have some errors, so the program has to find the best match even though it is not exact.
The PuntSeq team would later upload the data to well known open databases so that it will be preserved forever! When ready, a link to the data would be uploaded to: www.puntseq.co.uk/data
- against all odds, the experiment worked and we got DNA out of the water, despite a bunch of non-bio newbs actively messing with random parts of the experiment
- PuntSeq and Biomakespace people, and all those tho do scientific outreach, are awesome!
- biology is hard
- creating insanely media rich articles like this is also hard, but the following helped enormously:
- Wikimedia Commons to store large media files out of Git
- Asciidoctor extensions to easily include those media files. The lessons learnt in this article were then an important motivation for Ciro's OurBigBook Markup, to which this article was later migrated.
- Nomacs to give Google Photos photos meaningful names and to edit people's faces out of pictures ;-)
- some scientific Wikipedia pages may or may not have been edited with better pictures during the course of writing this article
Protocols are the biologist term for "recipe".
I found that a lot of biology comes down to this: get the right recipe, follow it well even though you don't understand all the proprietary details, and pray.
www.qiagen.com/gb/products/discovery-and-translational-research/dna-rna-purification/dna-purification/microbial-dna/dneasy-powerwater-kit (archive) Here is its documentation: www.qiagen.com/gb/resources/download.aspx?id=bb731482-874b-4241-8cf4-c15054e3a4bf&lang=en (archive).
Manual archive: web.archive.org/web/20190911111136/https://www.qiagen.com/gb/resources/download.aspx?id=bb731482-874b-4241-8cf4-c15054e3a4bf&lang=en

www.qiagen.com/us/products/discovery-translational-research/dna-rn-a-purification/dna-purification/dna-clean-up/qiaquick-pcr-purification-kit/#orderinginformation (archive)
Manual archive: web.archive.org/web/20190911100243/https://www.qiagen.com/us/resources/download.aspx?id=e0fab087-ea52-4c16-b79f-c224bf760c39&lang=en
Removes PCR byproducts from purified DNA.
Repairs the ends of DNA, and also attaches an adapter protein to the DNA that makes them go through the pores of e.g. an Oxford Nanopore MinION.
www.fishersci.no/shop/products/nalgene-polysulfone-reusable-bottle%20-top-filters/10465781 (archive)
This is where we poured the water. It was not large enough for the entire 1L sample, so we had to do it a few times.
uk.vwr.com/store/product/8306728/microcentrifuges-ventilated-refrigerated-micro-star-17-17r (archive).
www.velp.com/en/products/lines/3/family/44/vortex_mixers/65/wizard_ir_infrared_vortex_mixer (archive).
www.gelifesciences.com/en/us/shop/protein-analysis/protein-sample-preparation/protein-enrichment/magrack-6-p-05761 (archive).
www.bidspotter.com/en-us/auction-catalogues/bscsur/catalogue-id-bscsur10011/lot-c6605b41-1a14-40e5-a255-a5c5000866e0 (archive) Cannot exact same product on official website, but here is a similar one: www.fishersci.co.uk/shop/products/lm-26-2uv-transilluminator/12382038 (archive).
Manual: biochromspectros.com/media/wysiwyg/support_page/support-simplinano/Simplinano-UM.pdf (archive)
- 2021-03-25: Oxford Nanopore Technologies retweeted this article, that's awesome!
- 2021: hackaday.com/author/wd5gnr1/ "SEQUENCING DNA FOR METAGENOMICS" by Al Williams (2021). This came after Ciro Santilli self promoted at: stackoverflow.blog/2021/02/03/sequencing-your-dna-with-a-usb-dongle-and-open-source-code/#comment-1411921
"De novo" means "starting from scratch", that is: you type the desired sequence into a computer, and the synthesize it.
The "de novo" part is important, because it distinguishes this from the already well solved problem of duplicating DNA from an existing DNA template, which is what all our cells do daily, and which can already be done very efficiently in vitro with polymerase chain reaction.
Notably, the dream of most of those companies is to have a machine that sits on a lab bench, which synthesises whatever you want.
The initial main applications are likely going to be:but the real pipe dream is building and bootstraping entire artificial chromosomes
- polymerase chain reaction primers (determine which region will be amplified
- creating a custom sequence to be inserted in a plasmid, i.e. artificial gene synthesis
News coverage:
Nuclera eDNA enzymatic de novo DNA synthesis explanatory animation (2021)
Source. The video shows nicely how Nuclera's enzymatic DNA synthesis works:- they provide blocked nucleotides of a single type
- add them with the enzyme. They use a werid DNA polymerase called terminal deoxynucleotidyl transferase that adds a base at a time to a single stranded DNA strand rather than copying from a template
- wash everything
- do deblocking reaction
- and then repeat until done
The third one from Cambridge after:
Note that this is a specific application of de novo DNA synthesis, e.g. polymerase chain reaction primers is another major application that does not imply creating genes.
Using de novo DNA synthesis to synthesize entire Chromosomes.
Synthesizing the DNA itself is not the only problem however.
You then have to get that DNA into a working living form state so that normal cell processes can continue:
Multicellular questions:
Apparently achieved for the first time in 2021: www.jcvi.org/research/first-self-replicating-synthetic-bacterial-cell by the J. Craig Venter Institute.
Man-made virus!
TODO: if we had cheap de novo DNA synthesis, how hard would it be to bootstrap a virus culture from that? github.com/cirosantilli/cirosantilli.github.io/issues/60
Is it easy to transfect a cell with the synthesized DNA, and get it to generate full infectious viral particles?
If so, then de novo DNA synthesis would be very similar to 3D printed guns: en.wikipedia.org/wiki/3D_printed_firearms.
It might already be possible to order dissimulated sequences online:
Articles were limited to the first 100 out of 288 total. Click here to view all children of Molecular biology.
Articles by others on the same topic
Molecular biology is a branch of science that focuses on the study of biological processes at the molecular level. It encompasses the understanding of various biological phenomena through the examination of biomolecules, including DNA, RNA, and proteins, and how they interact to govern the structure, function, and regulation of living organisms.

This is a section about Molecular biology!
For example, this sentence. And then another one.

This is a section about Molecular biology!
For example, this sentence. And then another one.