The following original model chooses piecewise constant oxygen consumption rates in a closed, well-mixed suspension. It assumes no gas exchange, negligible addition volume, a corrected sensor and sufficient oxygen throughout. The curves are invented teaching examples, not measured traces, fitted data or a reconstruction of Figure 6.
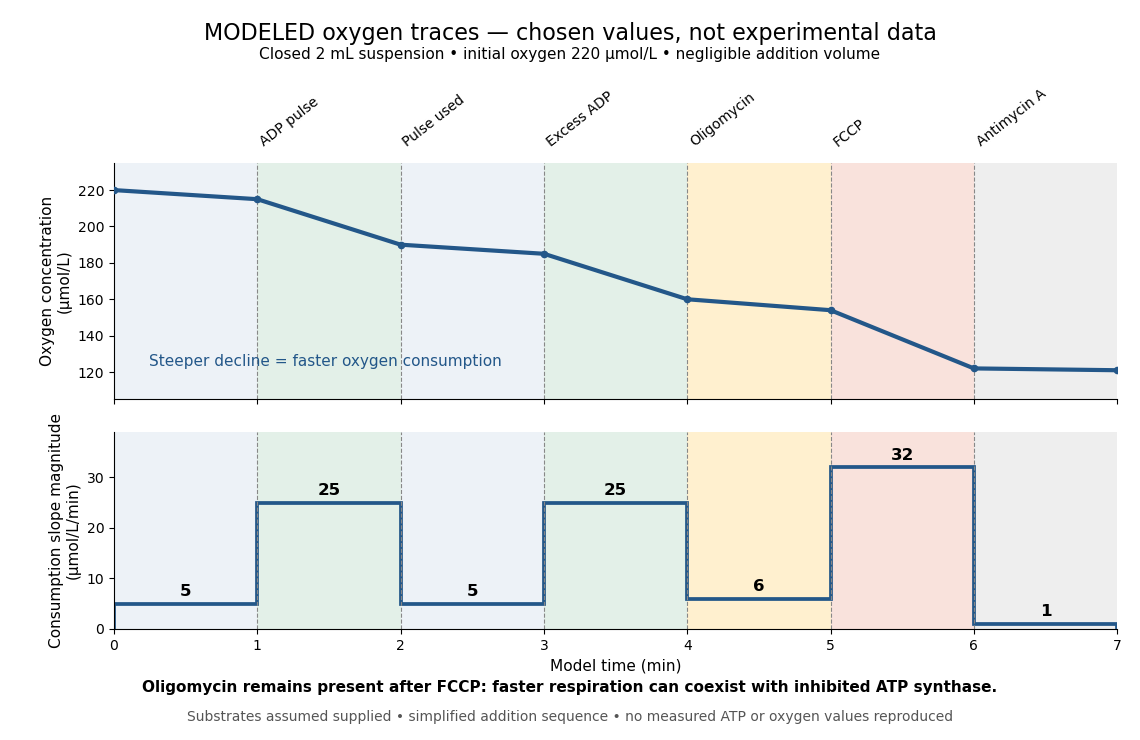

Start at . On successive one-minute intervals, choose positive slope magnitudes . Integration gives the endpoint concentrations . This is just the recurrence , with ; the step plot shows . The trace remains above zero by construction.
During the second ADP interval, the total consumption rate isWith a stipulated mitochondrial protein mass of , that is . Using a denominator twice as large would halve this reported rate without changing the raw oxygen trace. Comparisons therefore need both loading and the chosen denominator.
For a second bookkeeping check, the modeled post-antimycin A slope of corresponds to background. If that background is additive and unchanged in earlier windows, subtraction gives , and for excess ADP, oligomycin and FCCP, respectively. The oligomycin-sensitive difference is . It is a difference in oxygen consumption under the chosen interventions, not an ATP production rate. Converting it into one requires additional coupling assumptions or an independent ATP measurement; the FCCP interval shows why slope alone cannot supply that conversion.
Across the whole seven-minute example, consumption is , also the sum of the seven interval consumptions. This equality checks the rate-to-amount accounting independently of how the intervals are named. Actual records require attention to calibration, mixing transients, background stability and decreasing oxygen availability; a line that steepens or flattens alone does not identify the cause.
Articles by others on the same topic
There are currently no matching articles.