Optical fiber attenuation is the reduction of transmitted optical power along an optical fiber. Define a positive loss in decibels by comparing optical power already launched into the guide with surviving optical power :The factor ten applies to a power ratio; the factor twenty applies to a wave amplitude ratio only when power is proportional to its square under the same conditions.[ref]
Introduction to Optical Fibers, dB, Attenuation and Measurements by Cisco. Introduction to Optical Fibers, dB, Attenuation and Measurements, What is a Decibel?, Base 10 Logarithm Rules and Power/Voltage Gains: attenuation convention
For a uniform illustrative model with constant loss coefficient in and distance in kilometres,For over , the loss is andThus about of the launched optical power survives and is lost. This is an illustrative coefficient, not a property of all optical fibers, and is independent of the earlier illustrative refractive indices.
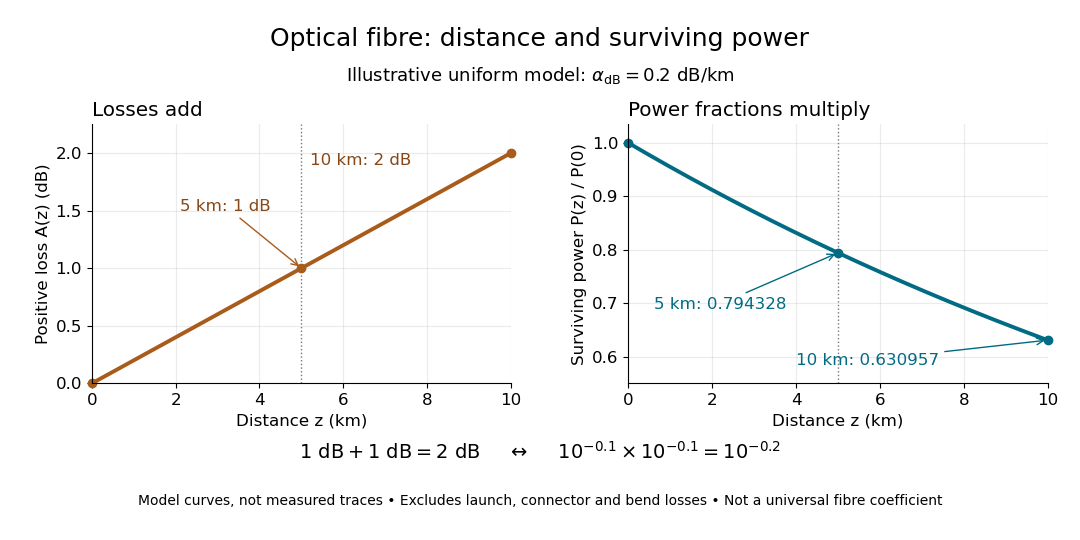

The exponential decay follows from assuming each equal distance interval transmits the same fraction. For two such intervals, power ratios multiply; their logarithms add, so the losses in decibels add. Two sections each transmit ; together they transmit . The loss curve is straight in decibels and curved on a linear power scale.
Wave absorption and scattering of light can remove guided optical power even in a straight fibre, while bends can let it escape. Entrance losses, joints and connectors contribute additional losses; they belong separately from a uniform distance coefficient. This is why a measured end-to-end power ratio need not equal the straight-fibre model.[ref]
Introduction to Optical Fibers, dB, Attenuation and Measurements by Cisco. Introduction to Optical Fibers, dB, Attenuation and Measurements, Understand Insertion Loss and Calculate a Power Budget: joint losses, launch dependence and distance contribution
An optical fiber cutback measurement estimates distributed optical fiber attenuation by comparing a long guide with the short input portion left after cutting the output end back. Keep the launch untouched. For the following original functional model, fix wavelength, source output, input alignment and collected output cone; subtract a dark reading and keep the photodetector in its linear range. Renewed end-face quality and changed normal mode populations can still spoil the comparison. The diagram describes a measurement principle, not Kao's historical short-glass apparatus.
Let be lengths in kilometres, the corresponding positive dark-subtracted readings, and the same launch and detection factor. A uniform guide obeysHere and its estimate are numerical values in . Dividing eliminates ; taking a logarithm proves the formula. A changed instead adds an error . Reconnecting the launch between readings defeats this cancellation.
For original chosen values , , and , the predicted long reading is . The ratio gives for the removed and hence .
Suppose an unremoved additive detector background contributes to both readings. Then the apparent coefficient isThis is a bias of an estimator: a common additive background pushes the ratio toward one, whereas a common multiplicative factor cancels. For independent small zero-mean errors with standard deviations on the dark-subtracted readings, a first-order Taylor expansion givesChoosing both standard deviations as gives . A shared estimated dark offset introduces covariance, so it requires a different uncertainty calculation. Near zero signal, the logarithm and this linear approximation become unreliable.
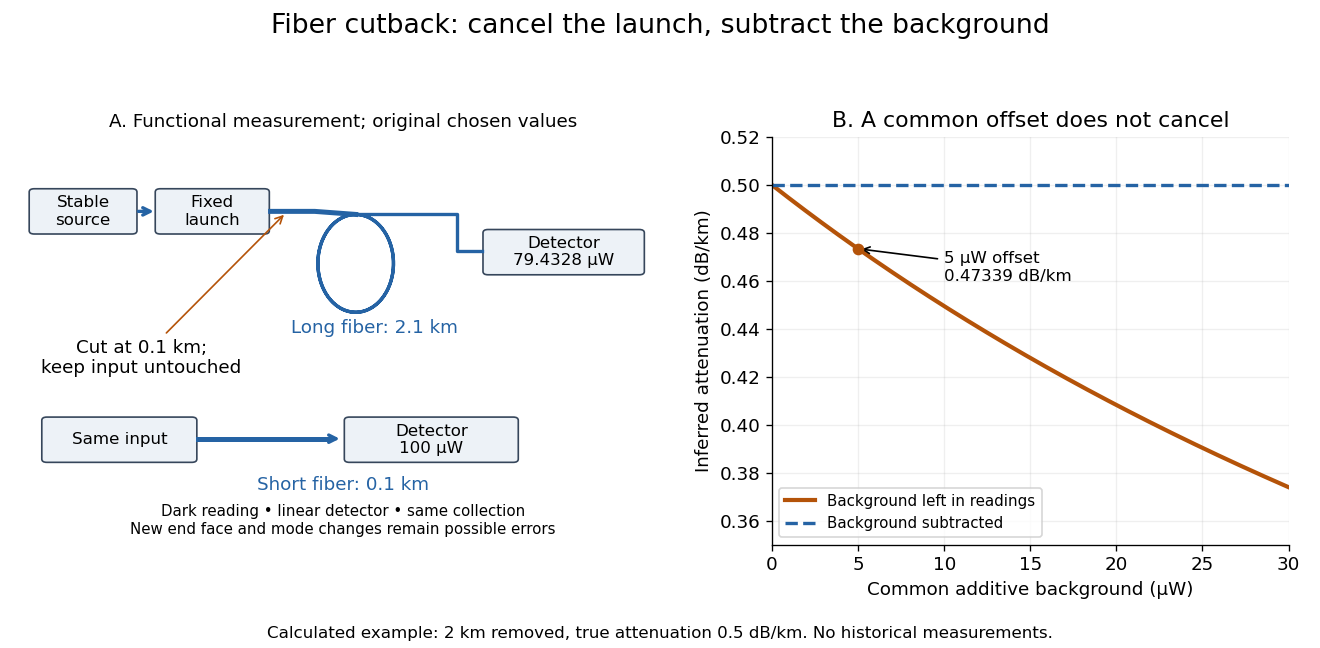
Optical fiber cutback measurement: fixed launch and additive-background bias
. Original functional schematic and calculated example. The launch stays fixed while the remote end is cut back. The graph uses the stipulated powers and lengths above; it compares dark-subtracted readings with a common positive unremoved background. No plotted point is a historical measurement. Details.
Articles by others on the same topic
There are currently no matching articles.