The Pareto distribution describes a positive random variable whose tail probability falls as a power law. In the shape–minimum convention used here, has shape parameter and minimum , with probability support . Its probability density function isThe minimum has the same units as ; the shape parameter is dimensionless. At fixed , changing gives a scale family, since . This convention is also used in uniform-Pareto conjugacy.[ref]
Pareto Probability Density Function. NIST Dataplot Reference Manual; Description: standard Pareto density and lower bound; source gamma,a correspond to alpha,beta here
The survival function and cumulative distribution function areFor , solving gives the quantile functionIts right-hand limit at is ; it tends to infinity as .[ref]
The Pareto Distribution. Random: Probability, Mathematical Statistics, Stochastic Processes by Kyle Siegrist; The General Pareto Distribution, Distribution Functions: density, CDF and quantiles; source a,b correspond to alpha,beta here
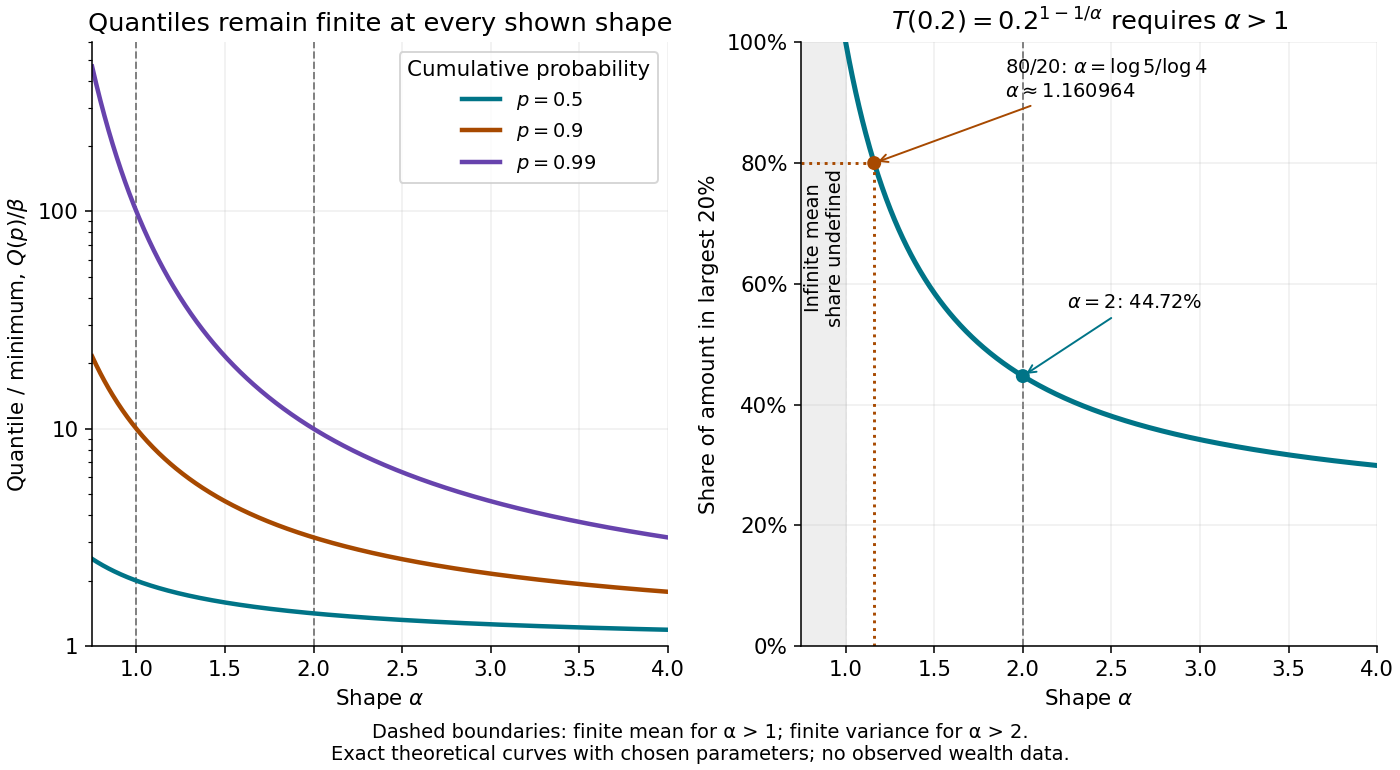
There is no probability mass at : changing a probability density function's value at that single point changes no probabilities.Choose and as an original theoretical example. Then , , the median is , and the 0.99 quantile is . These chosen values and all figures below describe mathematical probability distributions, not actual wealth observations.
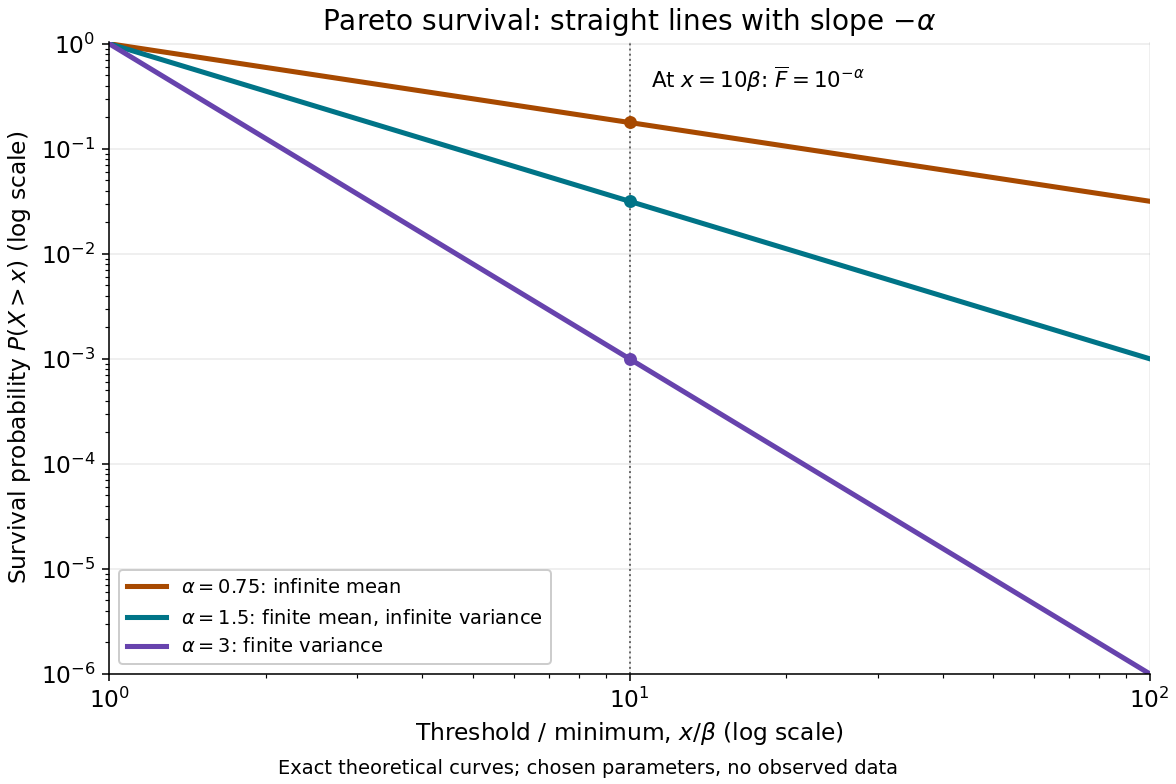
On this log-log plot, write to obtain . The slope is , whereas the probability density function has power exponent . Multiplying a threshold by ten divides its tail probability by . A larger therefore concentrates the Pareto distribution nearer ; a smaller makes extreme values more plausible. This exact scaling is useful when modelling large positive losses or sizes over several orders of magnitude.
The Pareto distribution is a heavy-tailed distribution: for every , the exponential moment diverges because eventually grows without bound. In contrast, the Laplace distribution has exponentially decreasing tails and some finite positive exponential moments. The Student's t-distribution also has power tails, but on both sides of the real line, with a smooth central region rather than a positive minimum.
Let have survival function for , with . Its expected value is . The tail-sum formula for expectation givesThe absolutely continuous probability distribution gives zero mass to the integers, so almost surely and . Taking expectations of gives , which rearranges to the displayed bounds on the Riemann zeta function. Finiteness is justified by and .
For the Pareto distribution of shape and lower bound , the density is strictly decreasing on . Its highest-density interval of probability , , must begin at . The tail probability makes the upper endpoint . If this is a posterior distribution, the result is its highest posterior density interval. In particular, Uniform-Pareto conjugacy supplies posterior shape and lower bound .
Let , where the summands are independent and identically distributed with Pareto distribution . Their positivity implies , so for fixed and ,Both outer expressions tend to zero. A single large summand already prevents a strictly negative exponential rate. No positive exponential moment exists, so the exponential-moment form of the Cramér theorem cannot be applied. The bound proves this logarithmic rate and does not assert an exact tail asymptotic. In particular, it remains true when lies below a finite mean, where the event need not even be rare. The stronger fixed-summand-count asymptotic in a heavy-tailed subexponential distribution is a separate statement.
A Pareto distribution is a proper probability distribution for every , even when its mean is infinite. To see both facts, integrate the probability density function against . For real ,The improper integral converges exactly when . At it diverges logarithmically; above that it diverges as a positive power of the upper endpoint. Setting gives one, proving normalization regardless of whether higher moments exist.
Taking and using when both terms are finite givesFor , the nonnegative random variable has expected value ; a centered variance about a finite mean is unavailable. For , the mean is finite and the variance is infinite.[ref]
The Pareto Distribution. Random: Probability, Mathematical Statistics, Stochastic Processes by Kyle Siegrist; The General Pareto Distribution, Moments: existence threshold, mean and variance
A finite total probability and a finite expected value answer different questions.At the chosen minimum , gives , and variance , but an infinite third moment. At , the mean is 30 and the variance is infinite; at , even the mean is infinite, while the median remains the finite number . At the boundary , the earlier example has mean 20 but infinite variance. A finite sample contains finite values almost surely; that fact cannot establish that the underlying mean or variance is finite.
Conditioning a Pareto distribution on exceeding a threshold changes its minimum while preserving its shape parameter. For and , the definition of conditional probability givesEquivalently, for ,The ratio to the threshold has the same Pareto distribution at every admissible threshold.[ref]
The Pareto Distribution. Random: Probability, Mathematical Statistics, Stochastic Processes by Kyle Siegrist; The General Pareto Distribution, Related Distributions: closure under right-tail conditioning
For the chosen , , only of outcomes exceed 20, but among those outcomes the probability of exceeding 40 is again . When , the same identity gives conditional expectation .This multiplicative scaling differs from the additive memoryless property of an exponential distribution. Indeed has exponential distribution of rate , because for . Thus logarithms turn multiplication into addition and explain the scaling property. Conversely, if has uniform distribution on , inverse transform sampling gives .
The excess conditional on has survival function for . In the generalized Pareto distribution convention , this means and . Here the excess starts at zero; the original Pareto distribution starts at .
Articles by others on the same topic



The Pareto distribution is a power-law probability distribution that is used to describe phenomena where a small number of occurrences account for a large proportion of the effect. Named after the Italian economist Vilfredo Pareto, it is often used to model the distribution of wealth, resources, and other types of measurable assets.