Convert number density into molecule count: . For the explicitly assumed representative cell volume , the two densities correspond to and . The concentrations alone do not fix fluctuation sizes without a volume.
For activation from zero messenger RNA and protein, solving the two mean rate equations givesThus all three normalized mean curves are almost identical. Sample paths differ. For Poisson transcription with biological translation bursts, the stationary Fano factor and squared coefficient of variation areOne way to obtain the fast-messenger RNA limit is to use burst arrivals at rate , a geometrically distributed burst with and , and independent unit protein degradation at rate . The first stationary moment gives ; the second gives .
At , typical relative fluctuations are and many small bursts make the trajectory smooth. At , they are ; individual bursts have mean normalized height , with only about bursts per protein lifetime. At , the relative fluctuations are again , but the typical burst height is and about bursts occur per lifetime. The latter two examples can look similarly noisy after normalization even though their mean molecule counts differ by two orders of magnitude. Burst arrival times and sizes fluctuate: a high-burst trace is not a periodic sawtooth.
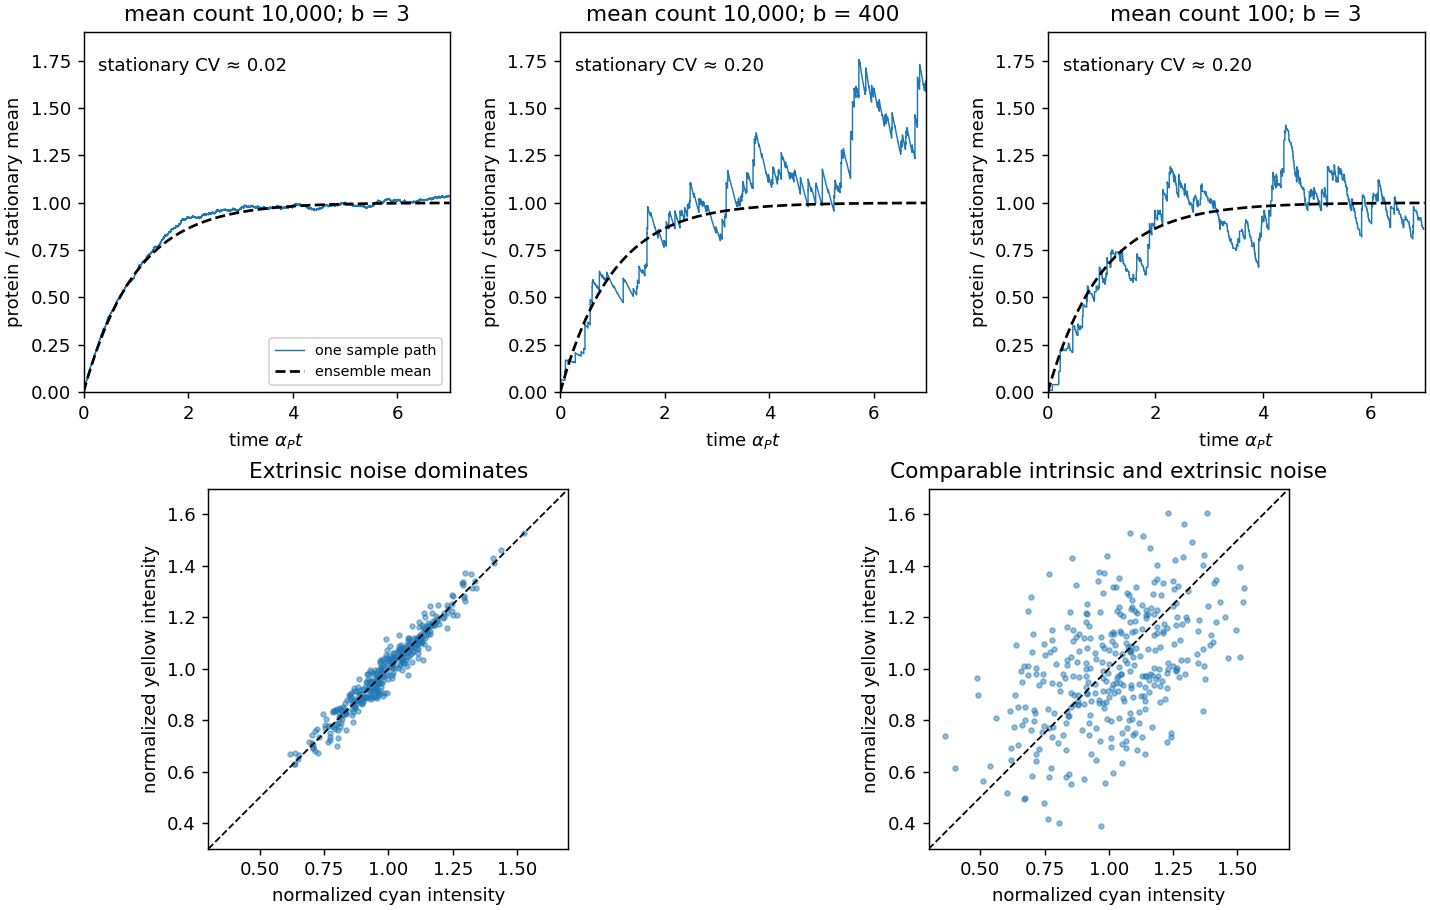
Stochastic gene expression trajectories and dual-reporter intrinsic gene-expression noise and extrinsic gene-expression noise
. Details. 
Articles by others on the same topic
There are currently no matching articles.