The fitted progressive illness-death model has three allowed arrows: with estimated transition intensity , with , and with , all in years. State 3 is an absorbing state, and state 2 has no return arrow.
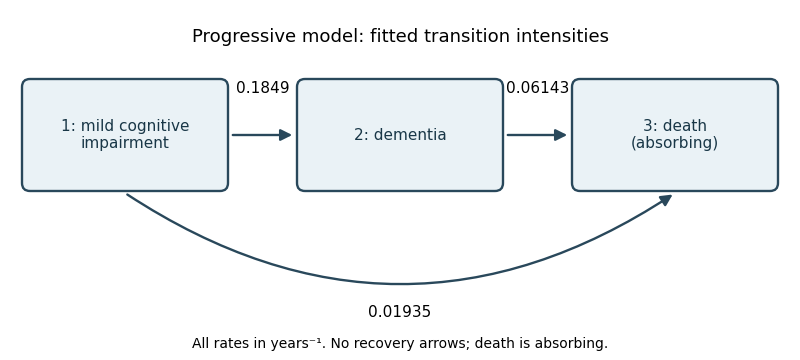
Progressive three-state model with estimated annual transition intensities
. Once in state 2, the holding time has an exponential distribution with rate , so the mean holding time from a transition intensity matrix isApply a confidence interval for an inverse rate to the printed rate interval : since inversion reverses order, the approximate 95% interval for the mean isThe time-homogeneous Markov property makes the future depend only on the current state; the exponential distribution also has the memoryless property. For a person currently in state 2,Equivalently, . Thus the fitted two-year death probability is approximately 11.6%.
Let contain sex, the education indicator, and age at diagnosis. Write for the sample means. The output's baseline transition intensities are evaluated at those means, so use the centred log-linear transition intensity modelThe full transition intensity matrix isThe fitted centred baselines are , and fitted slope vectors in sex–education–age order areThe two sex coefficients displayed as zero are fixed by the specified constraints; they are not estimated to be exactly zero. There are three free baseline transition intensities and seven free covariate slopes. The sample means are not printed, so uncentred intercepts at cannot be recovered numerically from this output.
Conditional on fixed covariates, subjects follow independent, correctly classified continuous-time multi-state models obeying the time-homogeneous Markov property, with . The progression is irreversible and death absorbing, with constant transition intensities during follow-up for each subject. In particular, the model uses fixed age at diagnosis rather than attained age. It assumes noninformative observation and censoring, and treats death times as exact through the mixed panel and exact-death likelihood. The Markov property rules out an additional effect of elapsed time in the current state after conditioning on it and the recorded predictors.
Under , the seven free covariate coefficients all equal zero. The likelihood-ratio test statistic isThe larger fit has ten free statistical parameters, compared with three in the constant-rate fit, so the reference chi-squared distribution has seven statistical degrees of freedom. Its 95th percentile is . Therefore reject at 5%; the p-value is approximately , and the covariate model is preferred. The two constrained sex coefficients add no free statistical parameters.
For the dementia-to-death arrow, the hazard ratio for higher versus lower education is , with approximate 95% confidence interval . Thus higher education is associated with a roughly 77.5% lower fitted death transition intensity, conditional on diagnosis age; the interval excludes one. This is an observational association and is not a direct multiplicative statement about death probability.
Each additional year of age at diagnosis multiplies the dementia-to-death transition intensity by , with confidence interval . The estimate suggests an increase, but the interval includes one, so this individual age coefficient is not significant at 5%. Sex has hazard ratio one for this transition by the model's imposed constraint. The output supplies no estimated sex effect or test of that constraint for this arrow. The nonzero sex coefficient for must not be mistaken for a sex effect on .
Articles by others on the same topic
There are currently no matching articles.