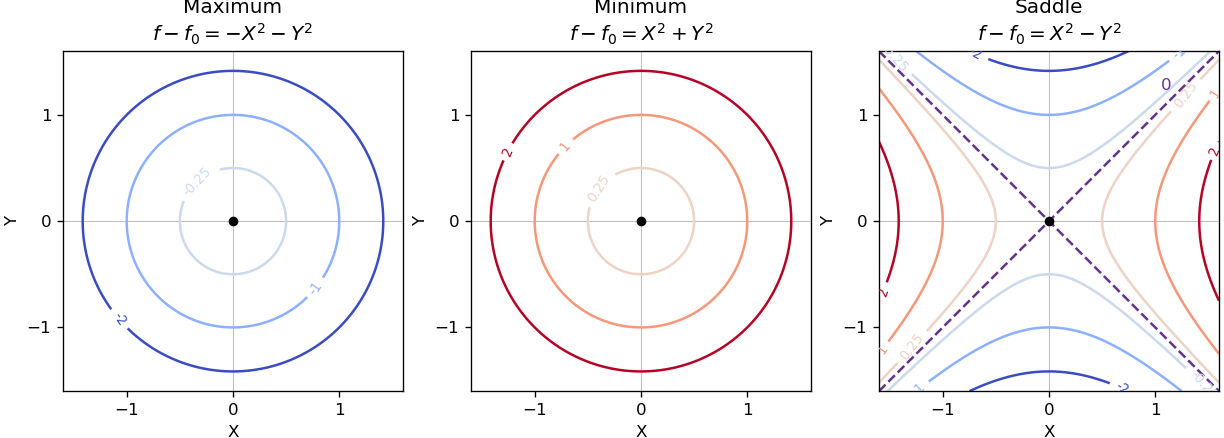
Near a nondegenerate stationary point, the quadratic part of the Taylor expansion determines the local contour plot. For a strict local maximum, the model gives nested closed level sets, with values decreasing as one moves outward. For a strict local minimum, the model gives the same nested shape with values increasing outward. Unequal nonzero quadratic coefficients stretch the circles into ellipses after a rotation to the Hessian matrix's eigenvectors.
For a nondegenerate saddle point of a scalar function, the model gives hyperbolas. Levels above open along the positive-curvature direction; levels below open along the negative-curvature direction. The critical level set is the two crossing lines . Degenerate stationary points can have different local geometry, so these are the standard nondegenerate sketches.

Articles by others on the same topic
There are currently no matching articles.