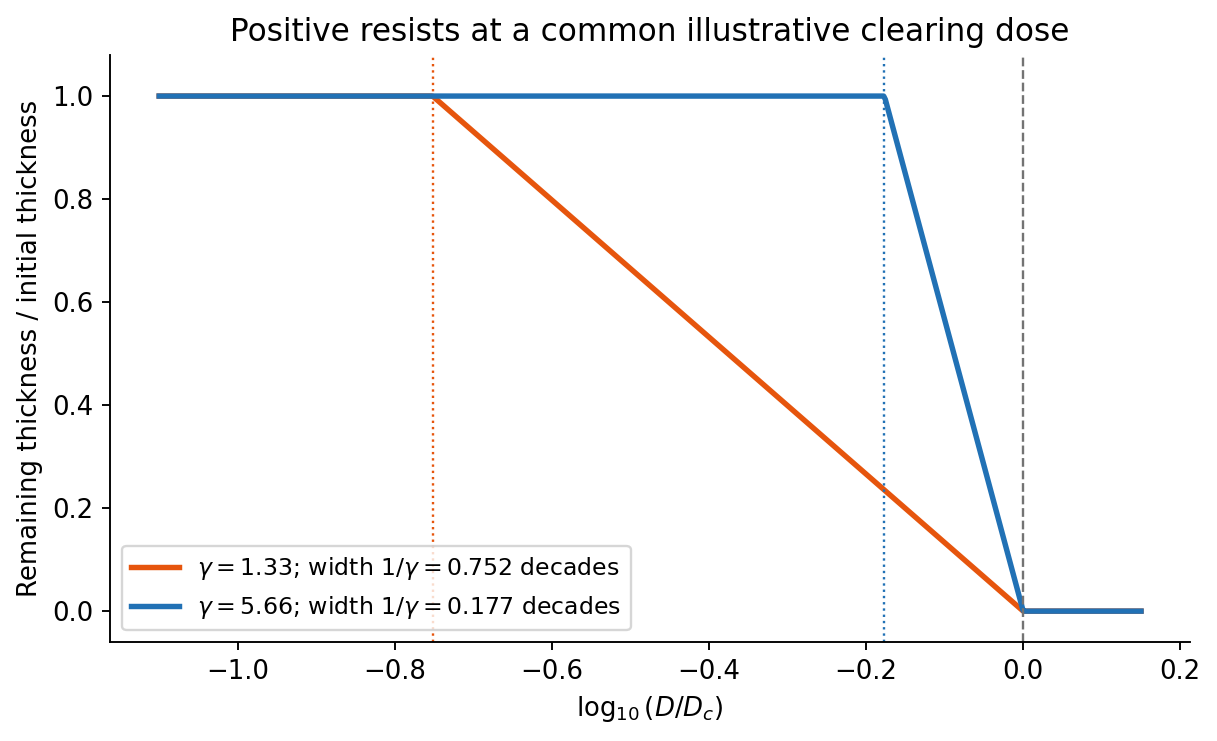
On a graph of normalized remaining thickness against , both positive photoresist curves remain near unity below and fall to zero by . Their transition widths are : decades for the lower-contrast material and decades for the higher-contrast material. The latter therefore has a much steeper transition. The curves can be aligned at a common illustrative clearing dose; their absolute horizontal placement cannot be inferred from photoresist contrast alone.
The higher-contrast material distinguishes bright and dark regions even when diffraction has reduced their intensity modulation. The lower-contrast material requires a much stronger aerial-image modulation and loses small features earlier. Finite resist thickness, standing waves, acid diffusion, development conditions and photon statistics can limit actual performance beyond this threshold model.

Articles by others on the same topic
There are currently no matching articles.