Write the lattice reciprocal vector as in one dimension. The nearly-free electron model starts from and couples plane waves separated by G. Near a zone boundary, the two-wave Hamiltonian isAt the free waves are degenerate and the periodic potential opens a gap . A reduced-zone drawing folds k modulo G into , displaying multiple bands at each reduced wavevector. The original plot shows free folded parabolas, avoided crossings and an allowed vertical optical transition. [ref]
Solid State Physics by David Tong. Chapter2, nearly-free plane-wave mixing and Brillouin-zone boundary gaps
Including two spin states, filling a free Fermi sphere gives . A monovalent BCC cell contributes two electrons, soThe sphere therefore lies inside every first-zone face, since the supplied distance is the nearest boundary.
For the shortest BCC reciprocal vector, . In the zero-potential folded-band limit, the energy of a vertical transition from k along G to the neighbouring free branch is . It decreases over the occupied interval and is smallest at . Thus the monovalent BCC direct optical threshold isThe final state is empty because . Finite weak changes the energies and makes optical matrix elements nonzero; an exactly free electron gas by itself has no interband absorption. The expression is a leading weak-potential threshold, not a claim that every peak equals the onset.
Using the supplied lattice constants and bare-electron free bands gives and thresholds for Na,K,Rb. The source plot's broad higher-frequency features shift toward lower energy in the same order as a increases, qualitatively consistent with the predicted scale. Their peak shapes, heights and exact positions need matrix elements, band corrections and scattering; low-frequency intraband conductivity is a separate contribution. No measured trace is reproduced.
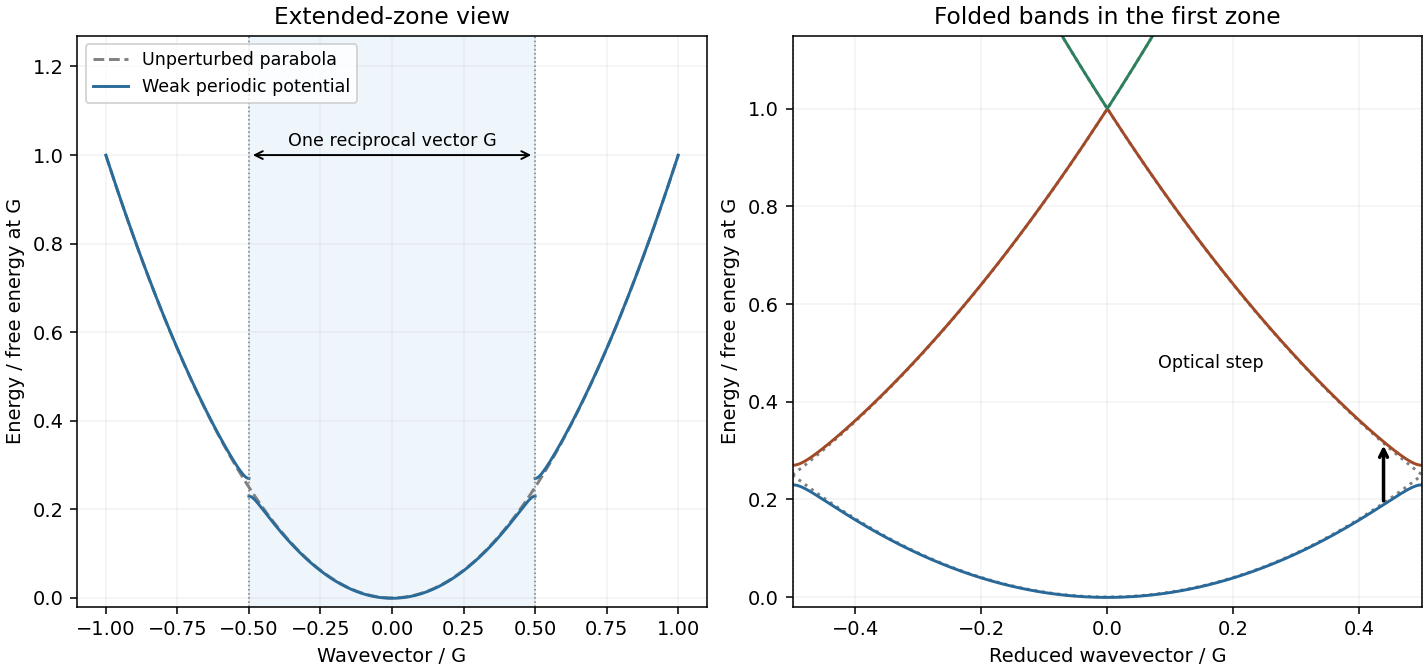
Nearly-free folded bands
. Illustrative weak periodic potential; gray curves are free bands and the arrow is a vertical transition. Source. Details.With a positive charge magnitude e, the relaxation-time equation for electrons is . Steady drift is opposite the field, , so the positive electron mobility and electrical conductivity areThis is the weak-field Drude model; the mobility is a magnitude, not the signed velocity-to-field ratio.
For an intrinsic nondegenerate semiconductor, . Equal electron and hole masses give and intrinsic chemical potential midway between the band edges. At300K, the exponential is . Using the later supplied mass givesThis is many orders below a typical metal's carrier density. Since , ordinary finite carrier mobilities leave its intrinsic conduction negligible on a metallic scale; the gap alone does not specify an exact conductivity without the mobilities.
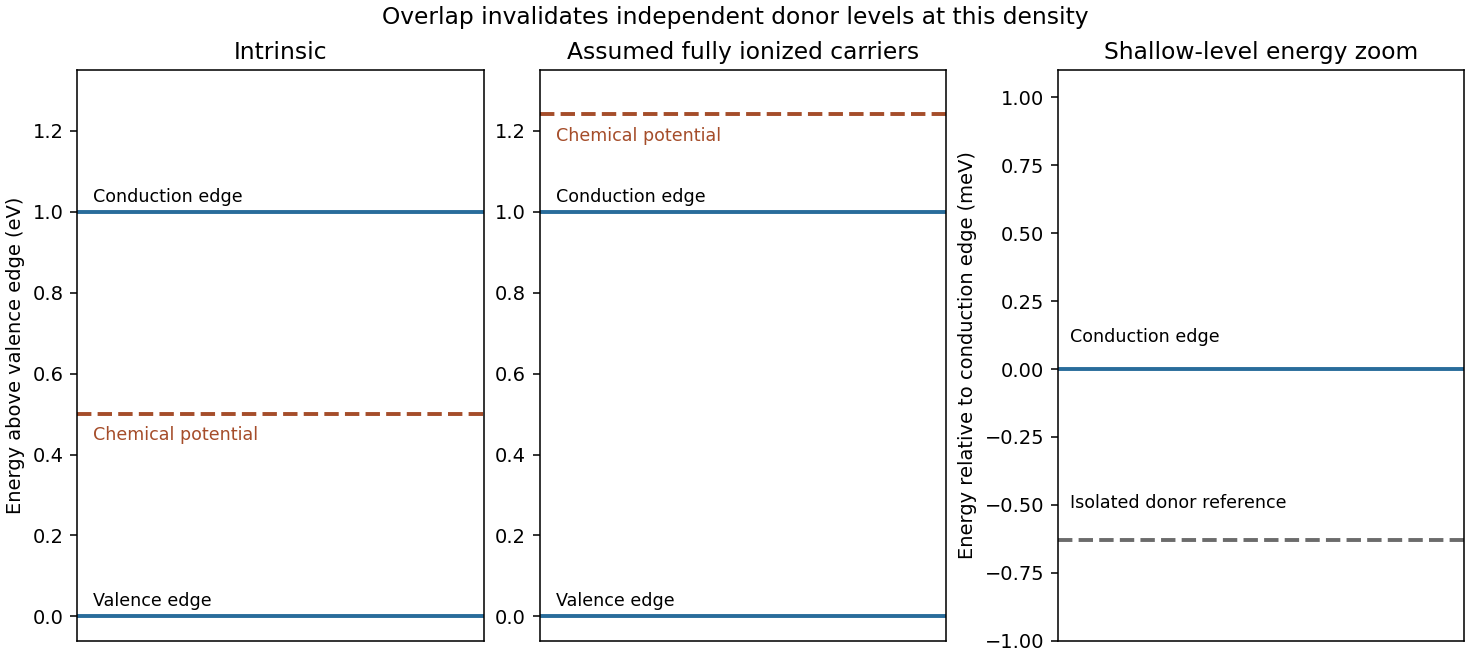
Under the explicitly stipulated full donor ionization, and the supplied mobility is . ThereforeThe band diagram places the intrinsic chemical potential at midgap and a shallow isolated donor level just below the conduction edge. The doped chemical potential moves upward. Quantitatively, the degeneracy test for a fully ionized light-mass donor gas gives , so a nondegenerate logarithmic chemical-potential formula is inconsistent. The parabolic-band zero-temperature estimate is ; its300K value is about0.241eV. The diagram accordingly shows the doped chemical potential inside the conduction band, not between an isolated donor level and the edge.
The hydrogenic donor state scaling using the supplied hydrogen values isThe binding is much smaller than , indicating a shallow donor on the isolated-state estimate. However, the mean donor spacing is only , well below the orbit radius. The donor-state overlap estimate invalidates an independent isolated-level ionization model at this concentration. Shallow binding supports abundant mobile carriers, but the full ionization versus isolated donor occupation distinction means full ionization cannot be justified solely by comparing binding with temperature while simultaneously retaining isolated levels and a degenerate chemical potential. The conductivity above follows the question's carrier-density assumption; an overlapping impurity/conduction-band description is needed for a self-consistent microscopic account. [ref]
University Physics Volume 3 by Samuel J. Ling and others. §9.6, donor levels and semiconductor doping; isolated-level picture distinguished here from the high-density limit


Articles by others on the same topic
There are currently no matching articles.